Run script through one index at a time

Hello,

I’ve researched this topic, and I found two types of threads: one that suggests that loops are necessary for those that need to adjust lacing and list formats, and the other that discusses either LoopWhile or List.Map. I’ve read up on both of those, but they’re not exactly sinking in, and I’m here to ask what path you suggest I investigate to accomplish the following task.

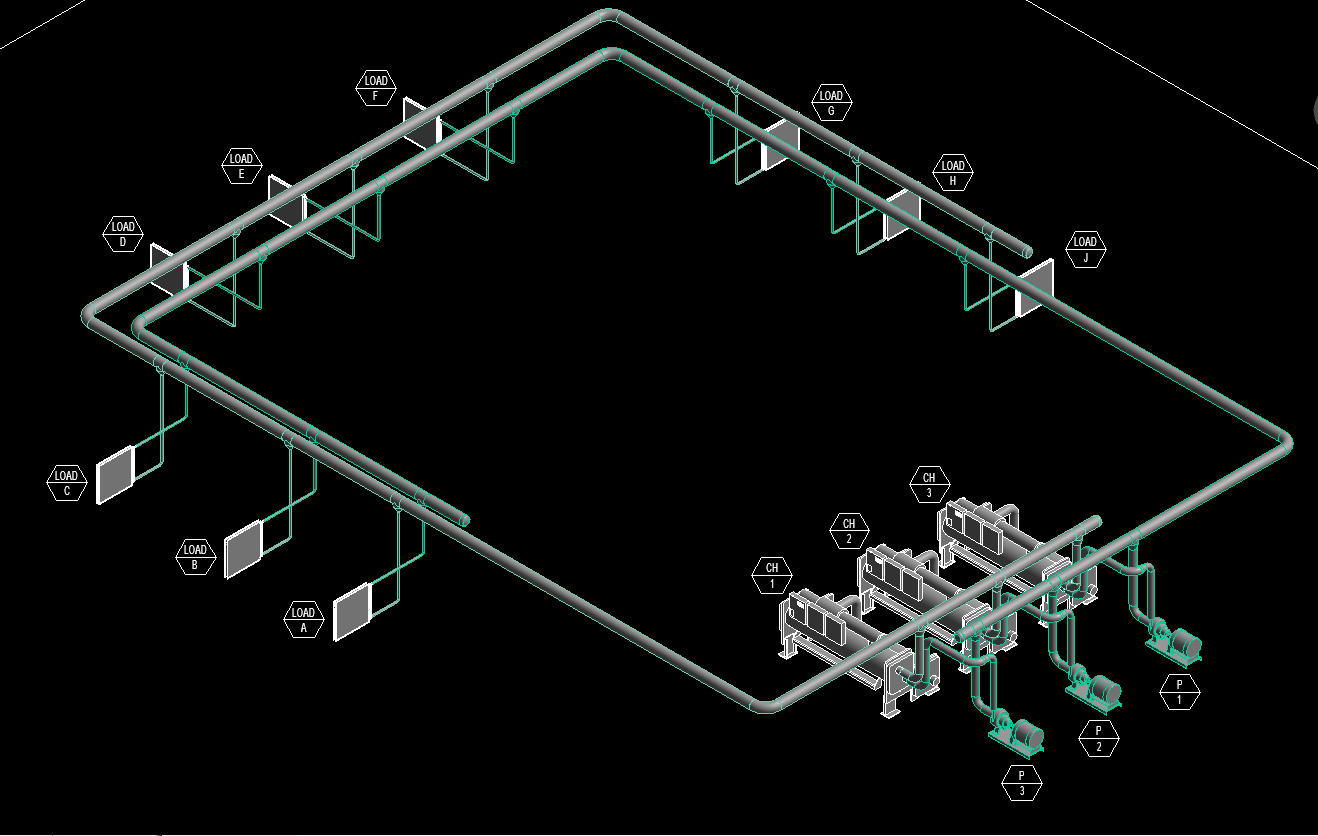
I have a sandbox Revit file with chillers, pumps, and coils. The coils are meant to represent different loads. These are identified as LOAD-A, LOAD-B, etc.

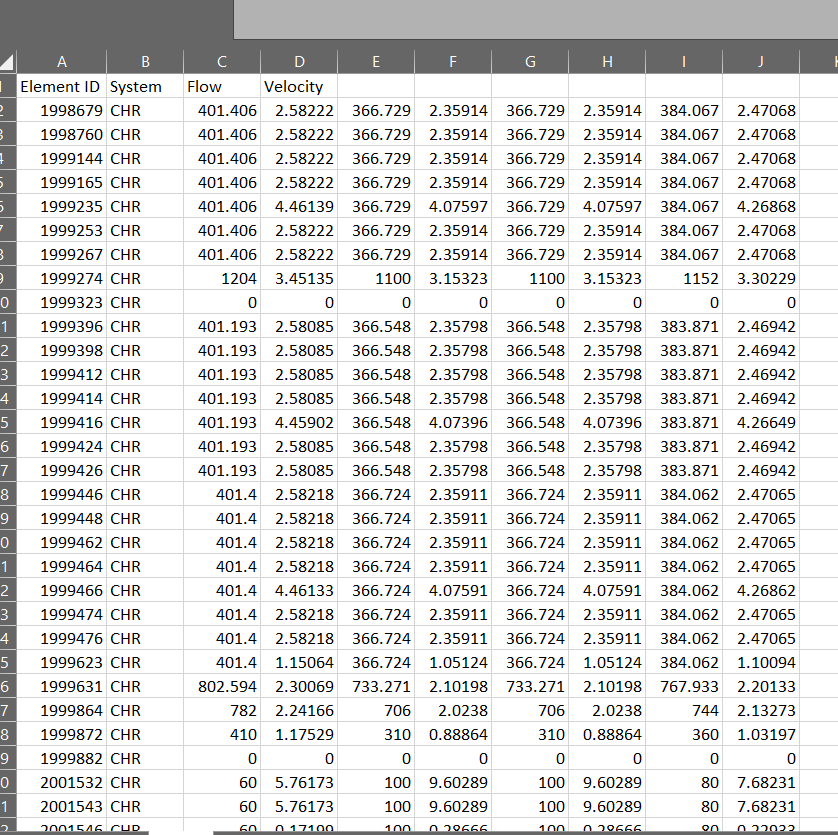
I also have a test XLS file that simulates the cooling load profile over the span of five datasets. The loads are listed in rows, and the data sets are by column.

image

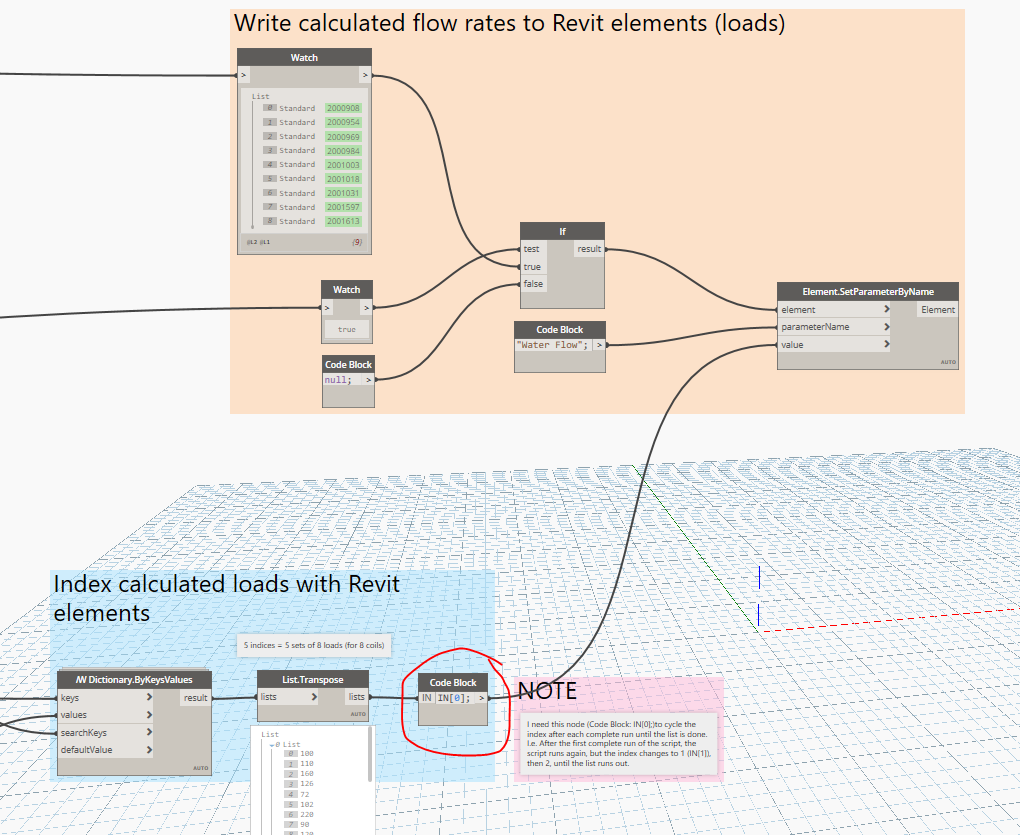
What I’m doing is taking these loads in XLS, calculating the flow rate for each load, and writing this info to the flow parameters for the loads (the coils). The data set for flow rates to be written to Revit coils is circled in red. The transpose list is a series of sublists of datasets; flow rates for dataset 1, then dataset 2, etc. until you reach the end of the list, which is dataset 5 from the XLS file.

There is another string of scripting that then pulls pipe flow and velocity data from Revit as a result of the updated load flow rates. The data is collected and written to another sheet in the same XLS file.

This works perfectly fine for running one data set at a time, but what I want to do is change the index that is analyzed and write the new flow data to excel in the next set of columns over. I want to keep running this until I’ve exhausted the lists in the List.Transpose node. The end-goal is something that looks like this:

To get the sample output, I had to manually change the index (circled in red two pictures up) to the next value, and change the column start for writing to XLS by two values (two columns to the right) for each run.

From what I’ve read, I imagine this is a tad more complicated than other posts I’ve read dealing with lacing since the second string relies on the output of the first string. I’m actually hoping that my previous statement just comes from ignorance and that it’s not actually as difficult as I make it out to be.

Anyway, I hope to get some feedback from you all. I’ve attached/linked the appropriate files for your perusal. I’m using archilab and Springs nodes; apologies if I’ve missed listing any others.

Revit file: https://drive.google.com/drive/folders/1Q3mu_e1kwFD8R-dCD7chVTZ5Ar7b5vVs?usp=sharing
Hydraulic Analysis.dyn (196.7 KB)
TEST load file.xlsx (14.4 KB)

1 Like

Don’t think of it as “one at a time”. Think of it as “all at once”. The current set of data isn’t dependent on the previous set, so iterating through each dataset isn’t necessary. Write your graph in a way that it calculates all datasets together, then manage your sublists to get the correct formatting. That should be much more manageable.

@Nick_Boyts I’ve seen you make that comment on a similar post, but I haven’t been able to wrap my head around this. I tried running the script without specifying the index, and it seemed to just run and run without me noticing any difference in the output XLS data. I thought that maybe it would write the different calculated values into the same fields, but I couldn’t see anything.

The main reason I can’t wrap my head around this is that the flow data is being pulled from the Revit model after new flow data is imposed on the family instance connectors. I can’t figure out how to do that with all of the sublists simultaneously since the pipe system analysis is the bottleneck. Does that make sense?

A few things…
a) If you change from running on a single index to multiple you will almost certainly have to change your graph to handle the new list structure.
b) I did miss the part where you’re relying on the Revit analysis for output. You could still replace the Revit analysis with Dynamo analysis and make this work though - depends on how intricate the analysis is.

Dynamo more or less executes “all at once” as a singular function in Revit. In order to get around this you’ll need to split each dataset into a separate transaction. Here are a few options that I think might help you with that:

  1. Python - This is likely your best bet. You can control the transactions in python and get outputs for each set this way.
  2. Custom Node - Not actually sure if this will work as I’ve not tried it, but you may be able to combine this portion of your graph into a custom node. The idea is that each dataset (a single input) would be applied to your model and exported to Excel within the custom node. You could then (potentially) use list levels to force the node to run for each dataset.
  3. Dynamo Player - Not exactly what you were looking for, but an easy way to quickly run through each dataset individually. Also has the added benefit of being able to update each set individually if changes are needed. Only works with Dynamo for Revit though.

Yeah, I thought about processing the analysis through Dynamo, but it would be outside the realm of what I’d want to attempt. I’m determining the loading on any part of the piping system based on changes to any part of said system.

  1. When it comes to using Python, I’ve only just begun learning Python on my Raspberry Pi, so I’m limited to basic functions with basic inputs and structure. The only thing I would think to look to are examples of while-counter applications for this purpose. Is this the direction I should be going, and are there resources you’ve come across that execute this format of data (not necessarily the pipe flow scenario, but something that moves from index to index and writes from column to column)?

  2. I’ve not played with this, but I think I get what you’re saying. That would imply that everything from the index down to writing to XLS would need to be nested in a custom node, yes?

  3. And finally, with Dynamo player, this would still require some input from the user to designate which dataset and column to write to, yes? With each run, DS pops up and I type in the next index and the next column?

  1. Basically. You could write a loop for each dataset within a transaction. The loop would include setting the parameters, wrapping it in a transaction, then getting the analysis portion back. The important part is the transaction within the loop.

  2. Correct. The idea is that the custom node has to do everything all at once so that list levels force the inputs to run separately for the whole series.

  3. Exactly. You could provide the index or get a list of “datasets” in a dropdown to chose from.

Thanks for your help, @Nick_Boyts. I’ve got more investigating to do with numbers 1 and 2; there’s a bit of learning curve, but I think it’ll be worth the time spent in the end. In the meantime, I’ll implement number 3.

1 Like