I have been able to successfully generate a graph to extract data from fabrication piping. I can collect all the data that I want. The issues I have running into is that I am struggling with how to best format the data to push to excel in the format that I am hoping to achieve. the first image below is the current structure of the data I have collected. The second image shows an example of how I would like the data to appear in Excel, and the final image is of the graph in its entirety. For the convenience of everyone willing to aid me, I have also attached my current dyn file. I would greatly appreciate any assistance or advice anyone is willing to offer. Thank you in advance.
FabricationPartsDataExtraction2Excel.dyn (27.2 KB)
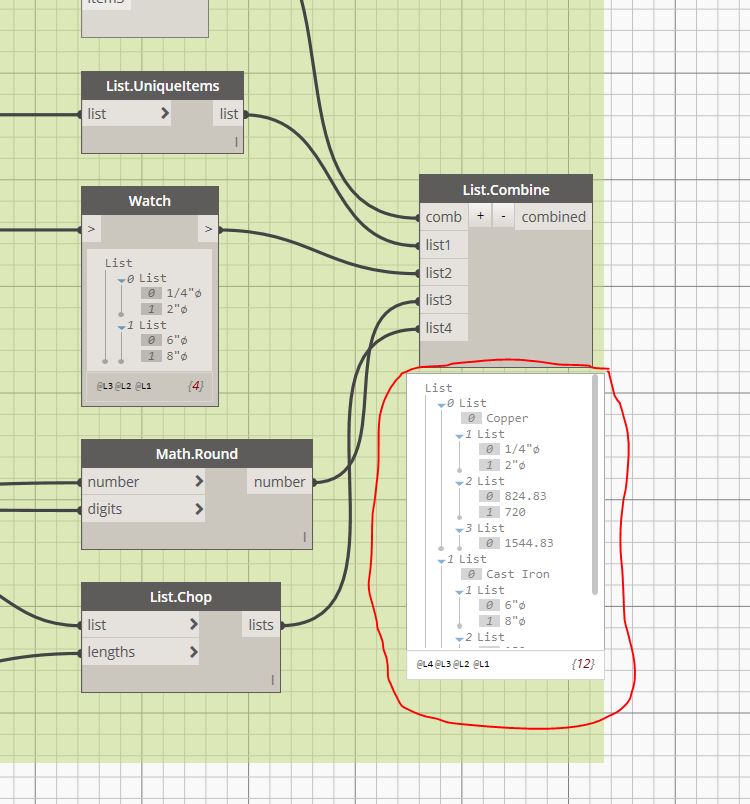
Current Data Structure:
Desired Excel Format Example:

Current Graph:
