Formatting Excel Using Dynamo

Hi Folks! This is my first Dynamo post (a few simple questions) although I have read many of all yalls post and answers and have learned that I have much to learn. :slight_smile: I look forward to when I’ll be able to contribute and help answer some question. But please for now know how grateful I am for any and all assistance getting myself up to speed.

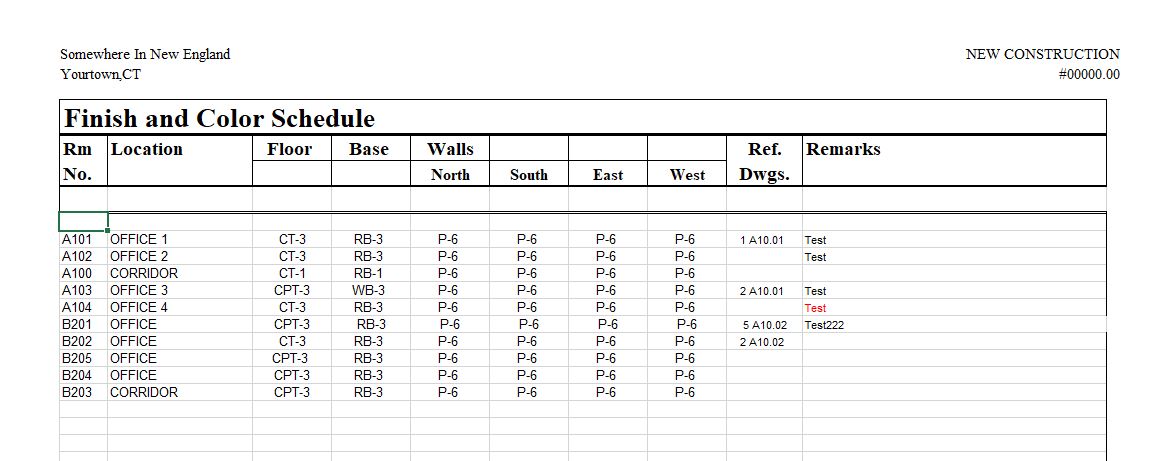
Now for my questions, I have learned how to export and import information from Revit to Excel and Excel back to Revit thanks to you all! My question is this, When my information is dumped into Excel it is all lumped together. I would like to get the information better organized in Excel.

My Dynamo graph is for a finish schedule.
I’m grabbing the Room Number, Room Name, Floor, Base and Paint Finishes.

When the information is exported into Excel, the Room Numbers are not sequential. This makes me sad :frowning: How would I get the data to hit Excel with the Room Numbers being in order (A101, A102, A103, B101, B102, B103, A201, A202, A203, B201, B202, B203)?

I would also like to to know if there is any way I can format certain lines using Dynamo? Our office finish schedule has project header and footer information and the “sheets” are set up, so I know I don’t need anything there, but I would like to have a line for each level saying “Level 1” with all the A101, B101, C101 rooms under that with another line for “Level 2” with all the A201, B201, C201 rooms under that etc., etc., etc., (said in King of Siam’s (Yul Brynner) voice).

I’ve attached some images of what I have so far. Please let me know if you need more details.

Revit 2018, Office 2016, Dynamo 1.3.3.4111

Thank You!
Donny!
ExcelImage|690x273

Adding the Excel Image…Thanks!

@TheCadman

Regarding sorting your room by level:

Regarding formatting your worksheet, you should look into the bumblebee package.

https://konradsobon.gitbooks.io/bumblebee-primer/content/230_border_style.html

Thank you Salvatore! I’m playing around with your suggestion for getting the levels to show up in Excel now.
I downloaded BumbleBee yesterday and was looking at the nodes in that package…now it’s just a matter of understanding what node does what and where to use it.
Because I’m just learning this, for me it is important to have a good foundation of knowledge and understanding. I much rather figure things out myself than have someone tell me all the answers…however I do appreciate a nudge in the right direction when I get stuck and hung up on a task…again, Thank you!!!

1 Like

@TheCadman Please mark as solved and post a new topic if you find another issue.

I’m still not understanding how to get the Levels to show in the Excel file. Currently all I get are the list of rooms which are out of numerical order. I would like to have them in numerical order as well.
I’m attaching an image file showing what I’m getting now (ExcelNow) as well as an image file showing what I would like it to be like (ExcelGoal).
I’m also attaching my graph so you can see where I’m at now. I haven’t figured out how to use the BumbleBee nodes yet or even which node I would use to accomplish my goal.


FinishScheduleRevit2Excel.dyn (25.2 KB)
Again, Thank You! for your patience and assistance thus far…I know it can be difficult trying to help someone who is still just learning.
Thank You!

You need somehow to edit the list and add an empty line, a Level X, and an empty line again for each level, before you write the data to the excel.

Exactly M.Perez. That and sort the rooms alphanumerically before it hits Excel.
Those are the two issues I’m having right now.
Any suggestions?
FinishScheduleRevit2Excel.dyn (22.7 KB)

Like @salvatoredragotta said, you can first sort the list by name and then by level:

For the other point I guess I would go for Phyton. Are you confortable with it? You could meake a loop that adds the lines when level from i is not equal to level from i-1. Probably there is a nicer way, but I am not a programming expert.

If you decide to go for “raw” Dynamo something like that may work. It is not that clean, but could be enought. In a few months you will want to rewrite it and then you will have the knowledge.

Instead of adding the level name you can add a null and at the end you can replace nulls with what you need.

1 Like

Hi @TheCadman,

I made some changes to your Dynamo graph.
FinishScheduleRevit2Excel_Modified.dyn (35.2 KB)

I think the first column now looks the way you prefer.
You still have to adjust the other columns yourself. I hope i gave you enough to do that yourself.
Keep in mind i used “Levels” and “Lacing” in some nodes, if you are not familiar with that do a search on the forum.

Kind regards,
Mark

2 Likes

Levels:
http://dynamobim.org/introducing-listlevel-working-with-lists-made-easier/

1 Like

Way better than mine :wink:

Mark,
Thank you, Thank You and THANK YOU!
I’m looking at your modifications to the graph now and trying to understand it’s logic.
Thank you for the link on List Levels also! This is the kind of information I need to better grasp Dynamo and working with lists.
M.Perez,
Thank you as well for all your efforts!
I understand there are many ways to get to ones destination.
I’m sure I’ll have an opportunity to use your suggestion on one of my future graphs.

I’m sure I’ll have more questions once I figure out how to word them properly and not look totally foolish.
Again, Thank You Both!

Hi Mark,
I went through and adjusted the graph for the other columns as you have shown.
I can see that the data looks good now, but for some reason it is no longer exporting to Excel.
I have no idea why?
Also, I created the “3 empty strings” as you suggested, but I don’t know why they are needed. I see them added to the list of data but not sure why they are needed or even if I added them correctly.
Can you please explain why these empty strings are needed?
Thanks, Don
FinishScheduleRevit2Excel_Modified2.dyn (75.5 KB)

The empty strings are there to make the empty rows.

2 Likes

So I realized I had added the columns wrong and modified it but I’m sure they still can be simplified some, however I’m still having an issue with getting the information into Excel.
I’m thinking that because the information is from multiple lists, that it won’t write to Excel unless I chop it up some how.
I’m now searching the forum for information on how to do that.
Attached is the graph as I have it now.
Thanks,
Donny
FinishScheduleRevit2Excel_Modified3.dyn (149.7 KB)

When you are testing a Dynamo graph you can freeze certain parts of this graph. So only the parts you interested in are run, not the whole graph.
It is possible i left the “Excel.WriteToFile” in “Freeze” mode :wink:.
You can check this by RightClick this node and see if there is a CheckMark in front of “Freeze”.
Remove this checkmark and the node wil it’s job again.

Hi Donny,

I think the graph below wil do what you asked for
FinishScheduleRevit2Excel_Modified5.dyn (70.1 KB)

Kind regards,
Mark