Hi,
I have no experience with pivot tables so unfortunately I can’t do this.
![]()
Hi,
I have no experience with pivot tables so unfortunately I can’t do this.
![]()
Hi Everyone,
Still struggling but still trying 
I have made some progress, I think… Here is my latest .dyn version with each list split from the rest and then combined and flattened. At least I am getting the information spread across the Excel sheet now and it is in a readable format, my current graph will not allow me to run the data through a transpose node, which is what I would like to do to present the information like Salvatore’s previous post which has the Excel image of how the data should be displayed.
Any suggestions would be greatly appreciated.
Thanks,
Des
Revisions on Sheet 5.dyn (32.5 KB)
Hi Desmond
This will not solve your problem, but simplify your graph heaps, you are turning into lists and flattening subsequently which is kind of counterproductive have a look here for how to simplify:
Thanks for your response but joining the lists as you have mentioned does not produce anything more desirable, it is in fact how I had my graph originally, before Salvatore mentioned the need to split the data. What you have mentioned here just puts each list on top the other in Excel.
Thanks,
Des
Hi @Kulkul
That is where I had the transpose in previous posts, but in the latest version it will not accept the transpose node in that location, if it did the information would probably come out like I want, but for some reason it wont, here is an image of the error message when I do put it there…
Thanks,
Des
Hmm at a glance, I think you may not want that List.Flatten node after your List.Create
Hi @awilliams
Which List.Create are you talking about? I have a List.Flatten after each List.Create and after the List.Combine node. You can see the actual graph in my previous post 22/27 on May 15th.
Thanks,
Des
@desmond.bolton well done!
You still need a lit more list management though.
Have a look below.

This will write the data like this:
 .
.
You need to do the following now:

You have lost me completely now, even though what you say does make sense and I can see what you want me to do, I just have no idea how to do this in Dynamo.


Hi Jacob
You are right- I should put this in as a formal request rather than just complaining about it.
I’ll get onto it.
However, I would see it as a part of an essential overhaul of the scheduling tool in Revit- which is pretty much unchanged as far back as I can remember (Revit version 8?). I am fairly certain that there must already be requests in the system for this.
Andrew
Apologies @desmond.bolton I hadn’t looked closely enough at the entirety of your graph when I made the recommendation to remove a flatten node.
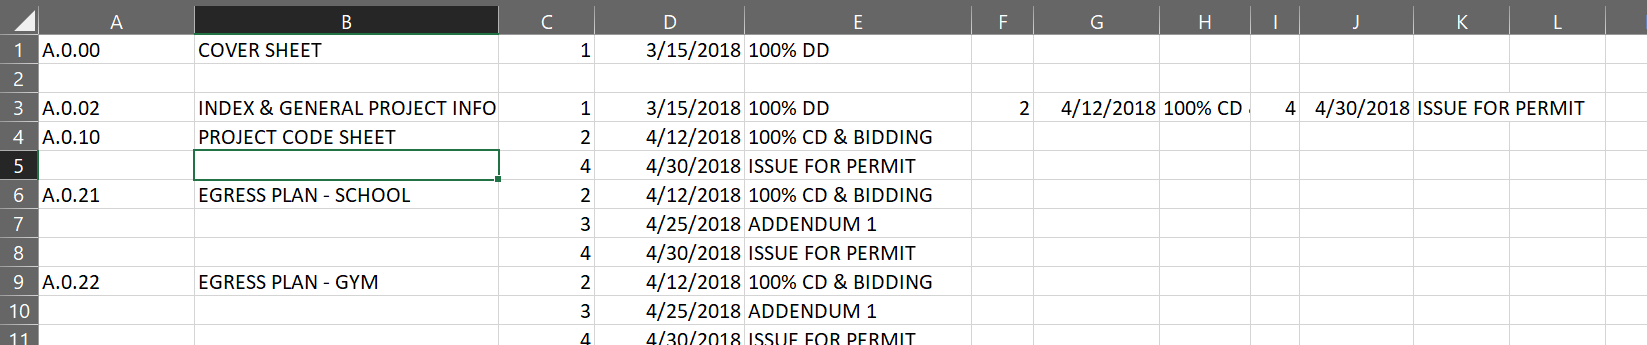
@salvatoredragotta has gotten you almost there you’re just missing the last bit on how to get those revision rows below the first revision and sheet number/name - sometimes it helps to learn to make a small sample Excel file structured the way you’d like it, and use the Excel.ReadFromFile node to see exactly how you need to structure your data to write it properly. If you read this way you will see that each of the cells with blank values for columns A and B read as nulls
I had a look at your .dyn file and I think there were a lot of unnecessary List.Create and List.Flattens in there after each bit of data. For the sake of clarity and concision I put notes in the graph below to try and explain the list manipulation that’s going on with each node, but overall I think it’d help best to make sense of it by first reading a sample xls file in Dynamo, otherwise my notes might sound like gibberish
The result in Excel looks like this (I believe this is what you’re after, and if I’m mistaken I apologize for the wasted reading)
Hope this helps
Hi @awilliams
You are an absolute legend…
Thanks for taking the time to help me out on this. I have recreated your graph and it works perfectly on the sample project, I even added more revisions and the graph picked up everything with no errors.
I then ran the graph on a couple of our live projects that have multiple sheets and multiple revisions and both times the graph runs with warnings at the same node, also the information is not complete in Excel (but I am supposing this is due to the erroneous node) and another thing I noticed is that the sheets are no longer in order in Excel (probably due to the error as well), I have attached the Excel output so that you can see. I have also attached an image of the node that is struggling, can you maybe have a look and see why it is giving an error. If you look at the total items in each node, you can see that the erroneous node is different and I am assuming it should be the same (414, 414, 439)
Here is the Excel output…
Revisions.xlsx (29.4 KB)
And here is the graph…
Revisions on Sheet 6.dyn (35.0 KB)
Thanks heaps,
Des
Ah there are two conditions that the current graph will fail by the List.Deconstruct node:
The graph I shared above failed to account for these conditions because, well, my sample file didn’t have them, oops! 
I think the best way to handle this would be to separate sheets with no revisions, sheets with only one revision, and sheets with multiple revisions, then join their data back together before writing to Excel. See the below graph (the non-green colored groups are the new additions since the last graph, and I colored the groups by the conditions they’re handling)
Additionally - the original graph only appeared to output the sheets sorted by their sheet number, because our sample files more than likely had each sheet element created in the same order as their sheet number. In actuality, the graph was by default sorted by element ID which follows order of creation. I added a bit towards the end just before flattening to write to Excel that uses Sort By Key to sort the lists by sheet number. I definitely suggest going through and doing all of the exercises in the Dynamo Primer once you’ve finished this graph
I qa/qc’ed your script (all the i’s & t’s then p’s & q’s) to make sure it was identical. I tested it with a small renovation project of mine near completion. It seems to only offset the Revs for Sheet A.0.02, . See images…
Then here is the progression listed out in Dynamo…
Is there an outlier maybe?
Here is that Excel file it produced…
Export Rev Test.xlsx (12.6 KB)
@cftrevizo Hmm, thats a strange output. Would you please upload your .dyn file and a screen capture of the whole graph with previews enabled (use the “Export Workspace as Image” button on the top right of Dynamo) It looks as though there’s something off with the some part of the list manipulation but I can’t tell where without seeing the rest 
Here it is…
What I’m looking into doing now any way is to just export all the data, then have an Excel Pivot Table report the way we are wanting to show it here. When I get that set up I’ll sharer it here.
The red line is where the problem is - you were filtering the sheets with revisions using the revision information from all of the sheets, so sheets with only one revision were producing data for multiple revisions

Hi @awilliams,
Sorry for my late response but I have been away for a few days.
Just so you know, I am revoking your previous legendary status because it is beneath you. You have excelled beyond that measly status… 
I have had a test run of your graph and it works like a dream, all sheets are now listed and in order and all the revisions for each sheet are showing.
I can not thank you enough.
I will mark your post as the solution.
Thanks Heaps,
Des
kindly post the final dyn file also if its not too much to ask for others to follow…
Thanks!


