Hello
I have data (somewhat small) that i need to see before exporting, kinda like “watch” node but want it in a table form, Is there a way to present it in dynamo without exporting to excel?
I know it can be done in Data-shapes, but im look for a different way??
An interface is most definitely the easiest way as you identified. Data shapes uses winforms I think, which can fairly easily generate data tables that give the script a moment to pause.
There isn’t a special table watch node im aware of in dynamo for this currently, although there are a variety of graphs in the 2025 version.
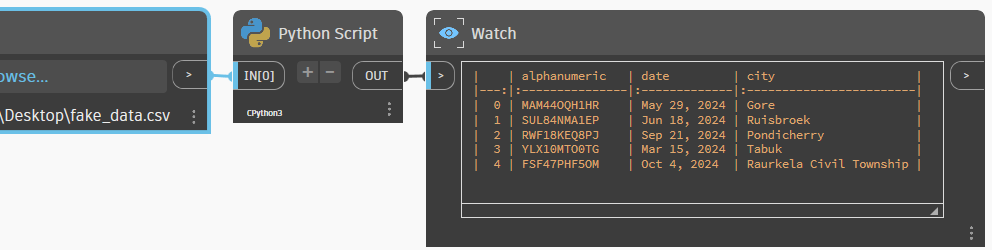
You can use pprint in python and some string formatting to get a lo-fi table
import csv
import pprint

with open(IN[0], "r") as file:
    data = [r for r in csv.reader(file)]

# get max length to column strings
col_width = [max(map(len, item)) + 1 for item in zip(*data)]

# columnise data
formatted_data = []
for row in data:
    formatted_row = []
    for w, i in enumerate(row):
        formatted_row.append(i.ljust(col_width[w]))

    formatted_data.append(formatted_row)

# print
OUT = data, pprint.pformat(formatted_data, depth=2)

If you have Dynamo 2.18+ (and can install the tabulate library)
Two Lines!
import pandas as pd
OUT = pd.read_csv(IN[0]).to_markdown()
Switching the user given solution to this as I like it more 
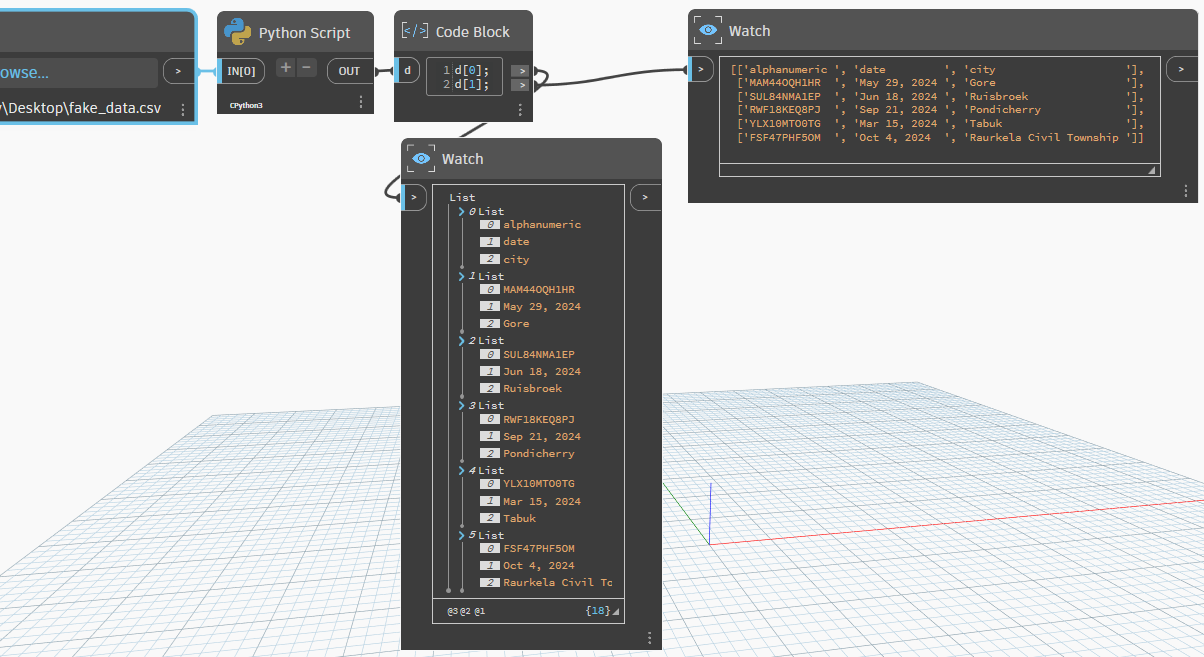
Very Interesting, I’m not a python savey, According to what you have shared, the input should be CSV file. while i need the input to be a list from dynamo, like this:
So i tried modifying it  by removing the csv input and creating a new parameter called X and keep the workflow as is but of course it didn’t work
You’re missing a update to Revit 2024 if memory serves…
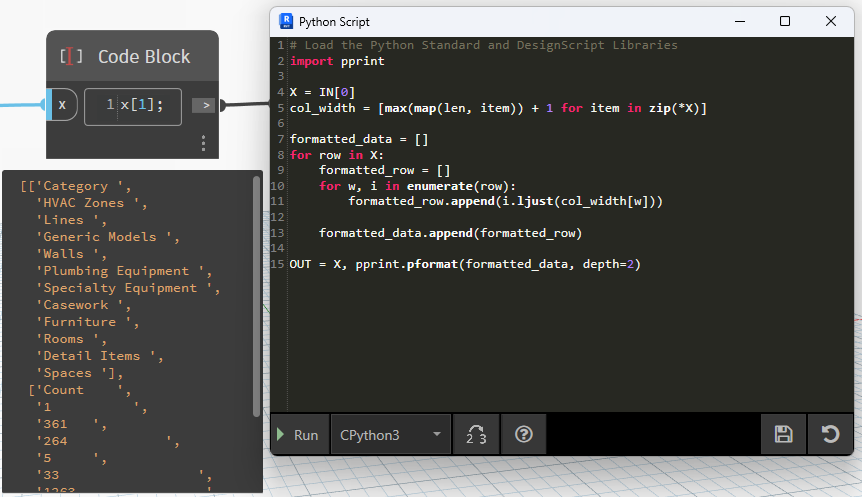
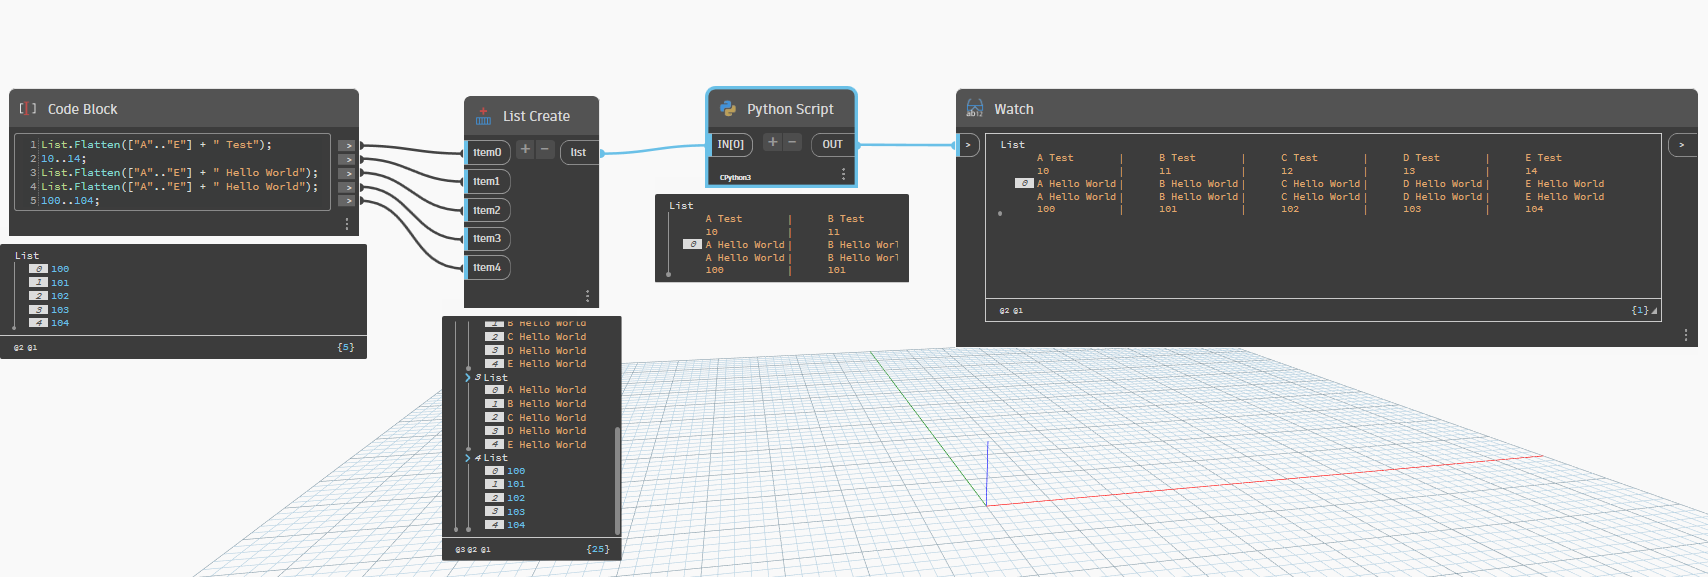
Updated
import pprint
from itertools import zip_longest

data = IN[0]

# get max length to column strings
col_width = [max(map(len, map(str, item))) + 1 for item in zip_longest(*data, fillvalue="")]

# columnise data
formatted_data = []
for row in data:
    formatted_row = []
    for w, item in enumerate(row):
        formatted_row.append(str(item).ljust(col_width[w]))

    formatted_data.append(formatted_row)

# print
OUT = pprint.pformat(formatted_data, depth=2)
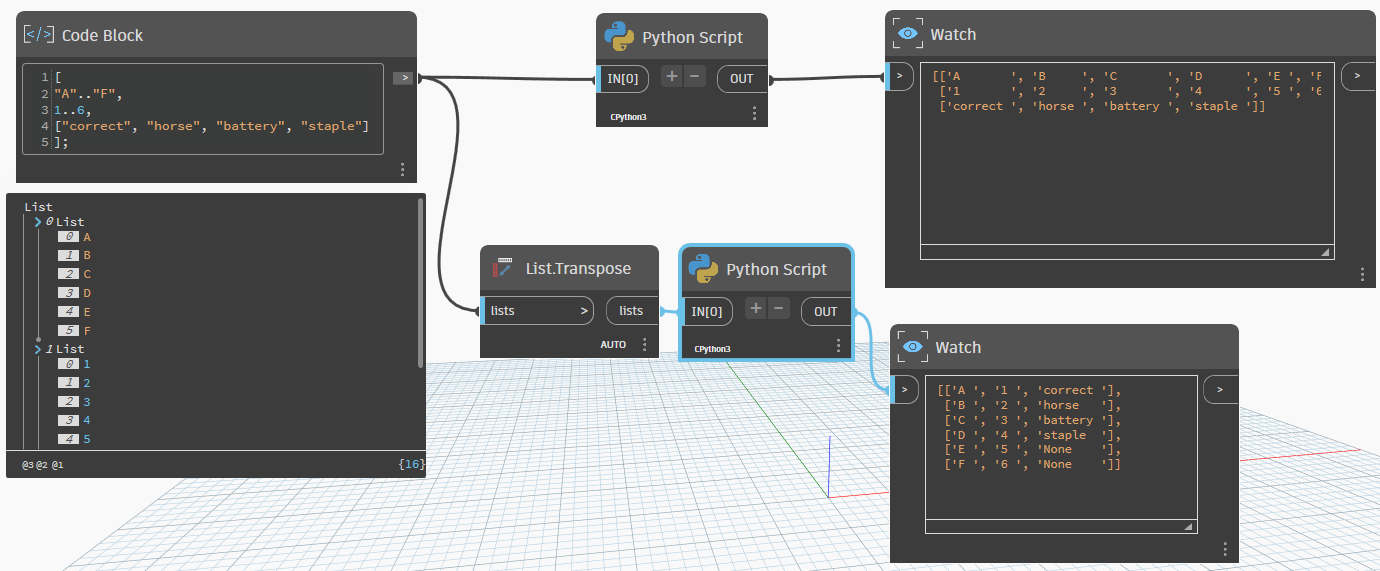
Another solution (assuming the lines are the same length)
import sys

def to_table(datas):
    """transform list to string table"""
    transpose_datas = [i for i in zip(*datas)]
    lst_size = [max([len(str(v)) for v in col_values]) for col_values in transpose_datas]
    value = '\n'.join(['\t|\t'.join([f"{x:<{lst_size[idx]}}" for idx, x in enumerate(row)]) for row in datas])
    return value

OUT = to_table(IN[0]),
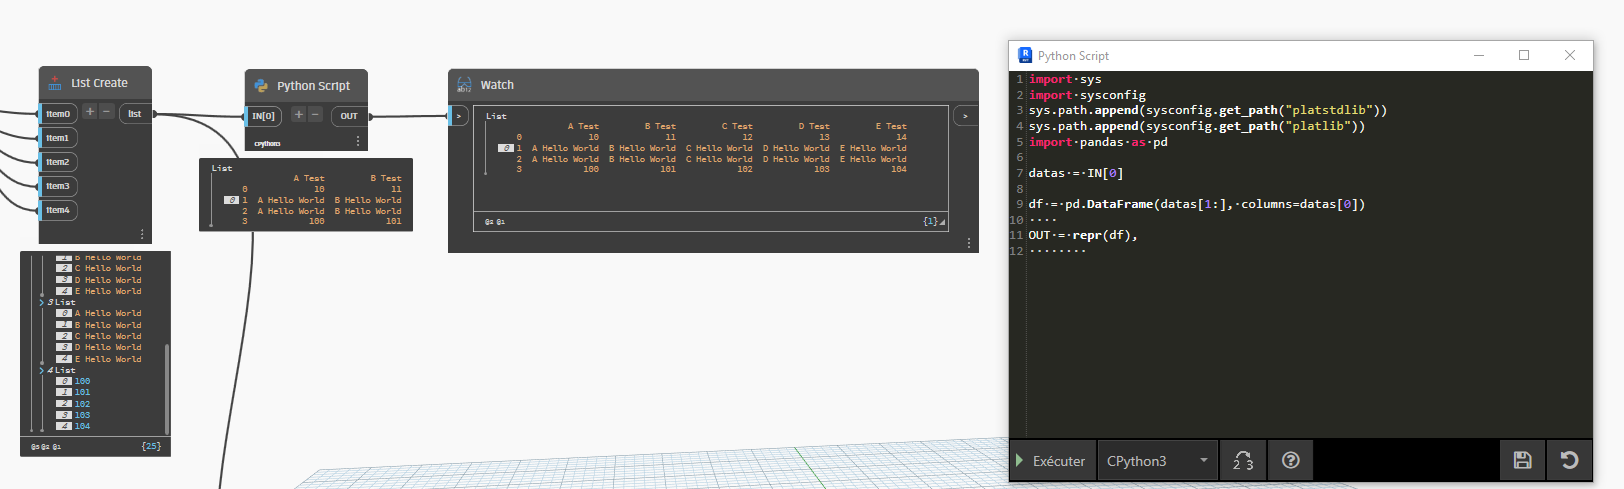
but I still prefer dataframes (or .Net DataTable)
need pandas python package