Hello Dynamo Friends ![]()
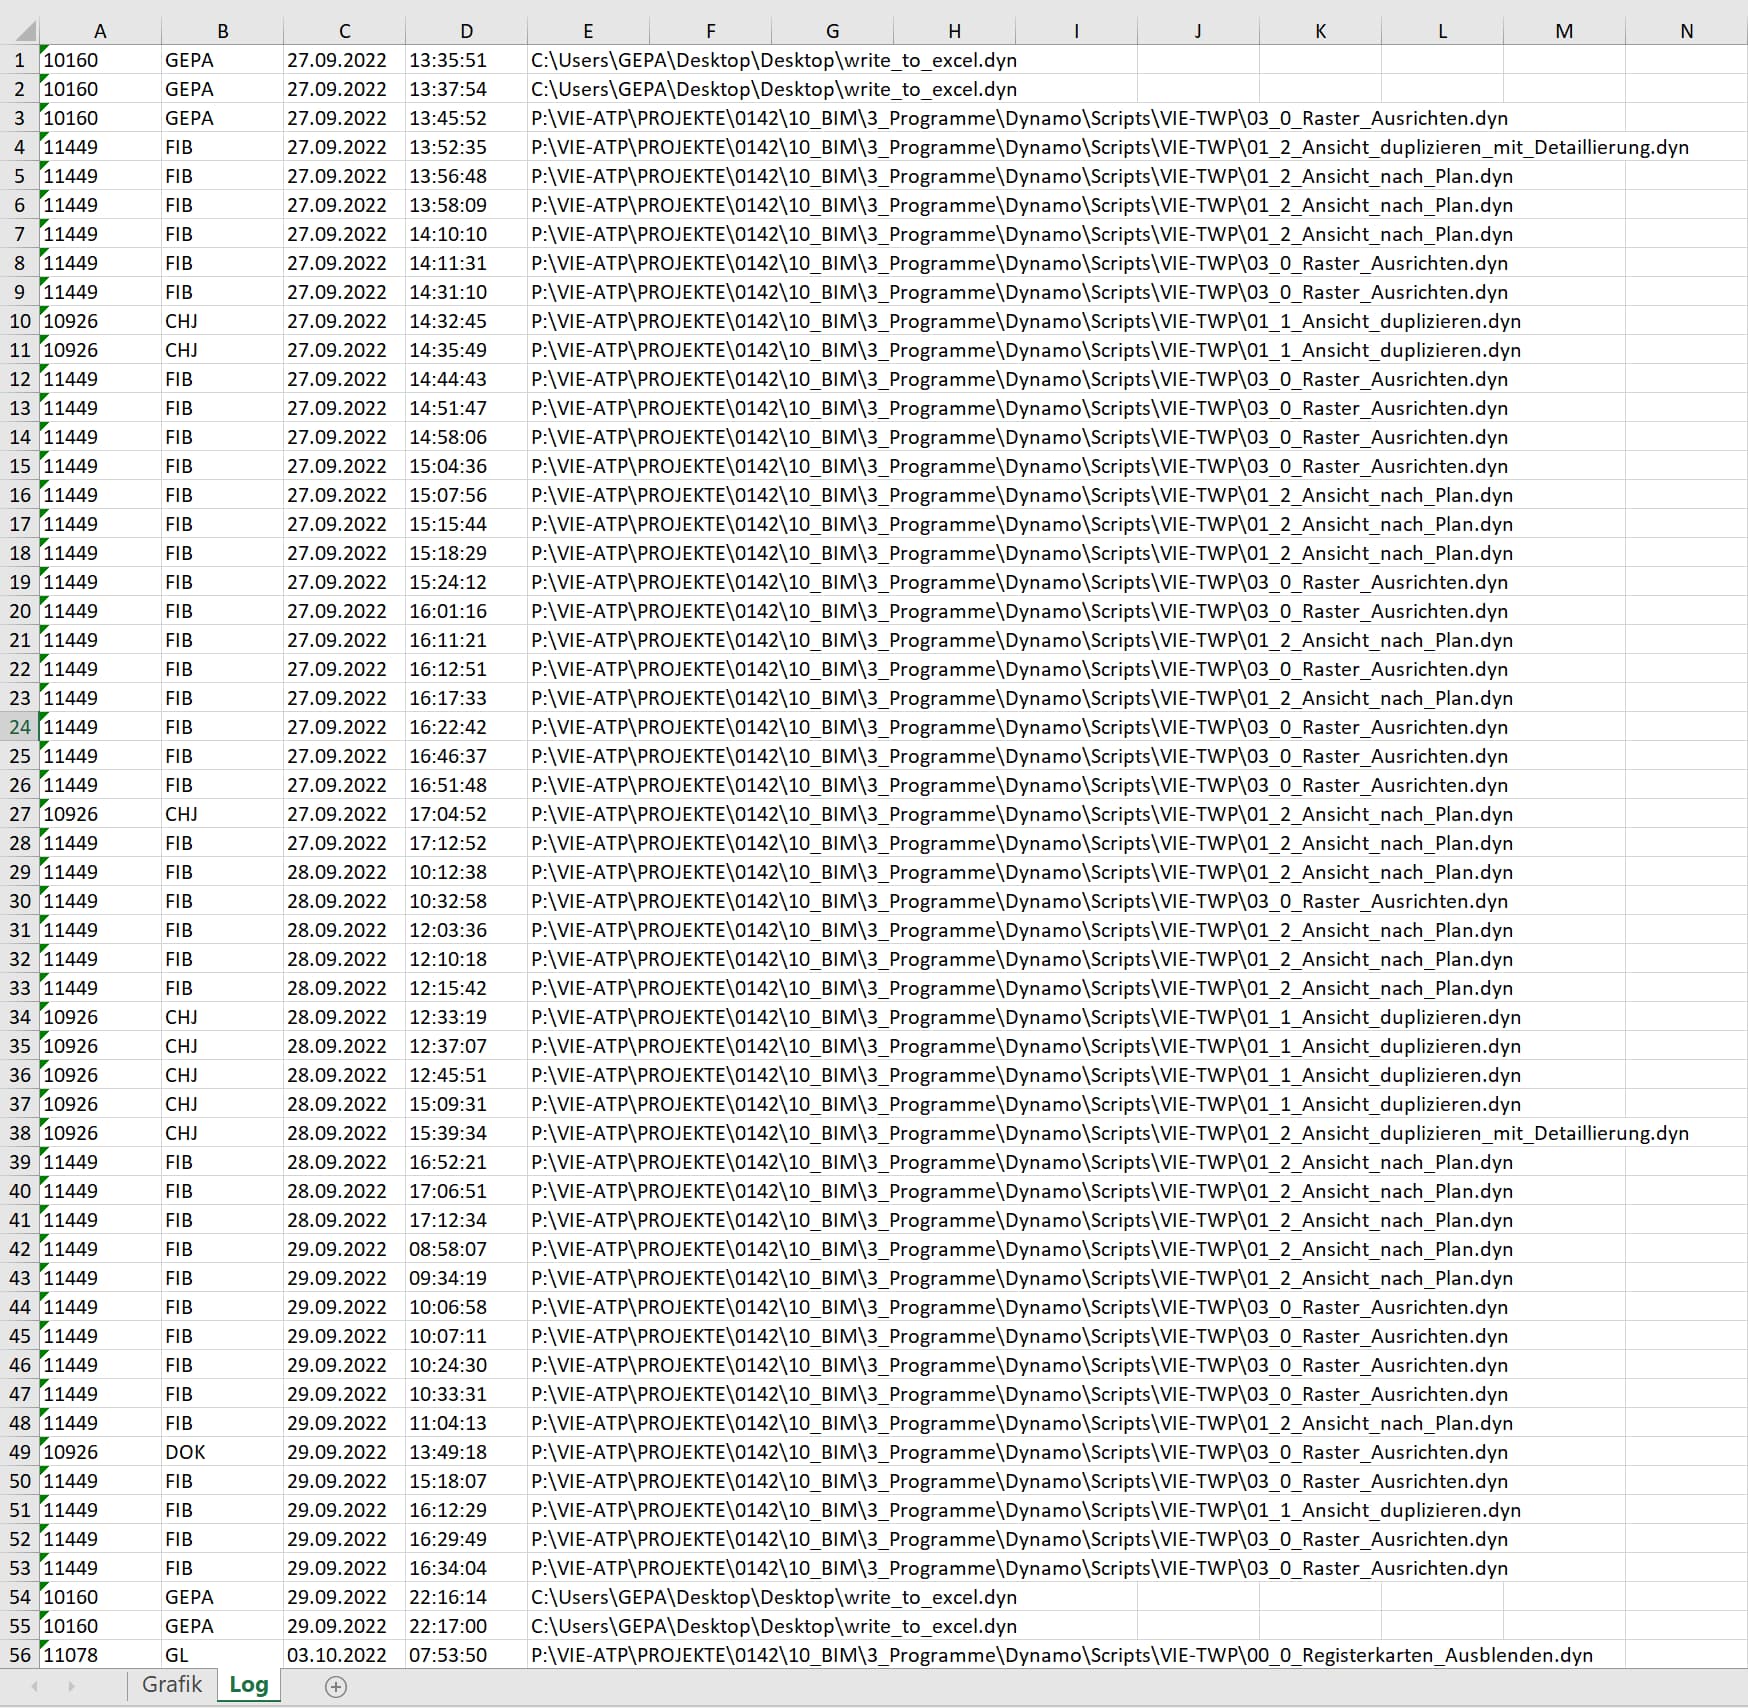
Inspired by some threads* on the board I´m now logging userdata and I´m trying to visualize it in excel.
I`m struggling with excel, i would like to share my workflow and I´m very interrested in what all you guys are using or have created regarding userdata and charts! And I would be very interrested in methods to vizualize data live with a webserver!?
My problem with excel:
The formulas (UNIQUE, COUNTIF) won`t update when i write data into the file with dynamo ![]()
When i write the data manually the formulas will update automatically and so will the charts!
So whats the difference between the dynamo and manual method?


import clr
clr.AddReference('DynamoRevitDS')
import Dynamo
clr.AddReference('DSCoreNodes')
import DSCore
from DSCore import *
clr.AddReference("RevitServices")
from RevitServices.Persistence import DocumentManager
from datetime import datetime

dynamoRevit = Dynamo.Applications.DynamoRevit()

currentWorkspace = dynamoRevit.RevitDynamoModel.CurrentWorkspace

dynamoFileName = currentWorkspace.FileName

app = DocumentManager.Instance.CurrentUIApplication.Application

userName = app.Username

now = datetime.now()
dateformat = "%d.%m.%Y"
timeformat = "%X"
date = now.strftime(dateformat)
time = now.strftime(timeformat)

OUT = userName, date, time, dynamoFileName
*Threads:
Sending emails - Developers - Dynamo (dynamobim.com)
Python to get scripts usage informations in your company - Developers - Dynamo (dynamobim.com)


