Hello I have a data that I would like to export to Excel. The ideal format of the data should be
1.List
-0. Data A
-1. Data B
-2. Data C
-3. Data D
2.List
-0. Data A
-1. Data B
-2. Data C
-3. Data D
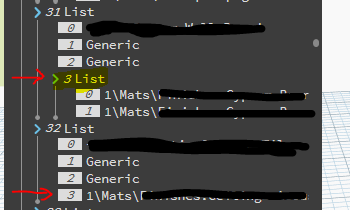
As you can see 31 List’s 3 List has two values vs 32 List’s 3 List
However, some of my ‘3. Data D’ has multiple values so Excel is causing errors when exporting.
What would be the best way to merge two sublists or subvalues into one? Once merging is done, I think i can put & in between to separate them.
Thank you so much for your time !
How do you want it to look in Excel? Excel only has rows and columns and that’s what the list structure represents. It seems like you just want to flatten the sublists to contain every value in sub 3 in consecutive columns.
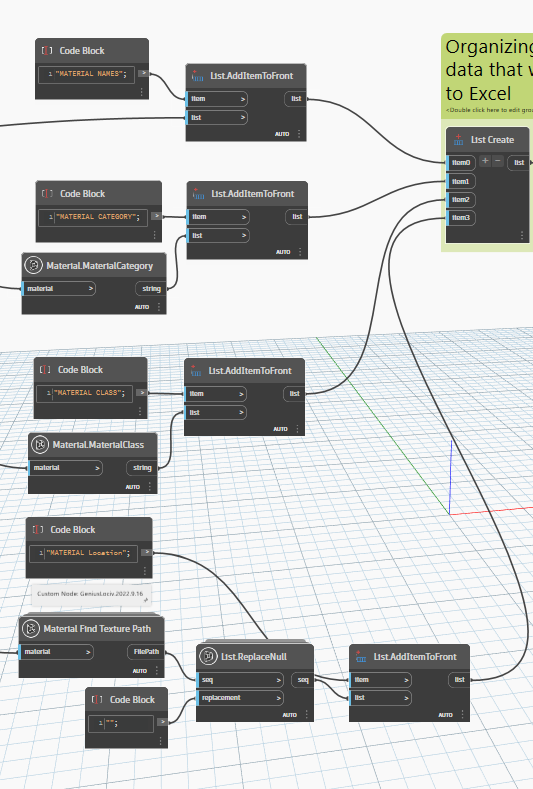
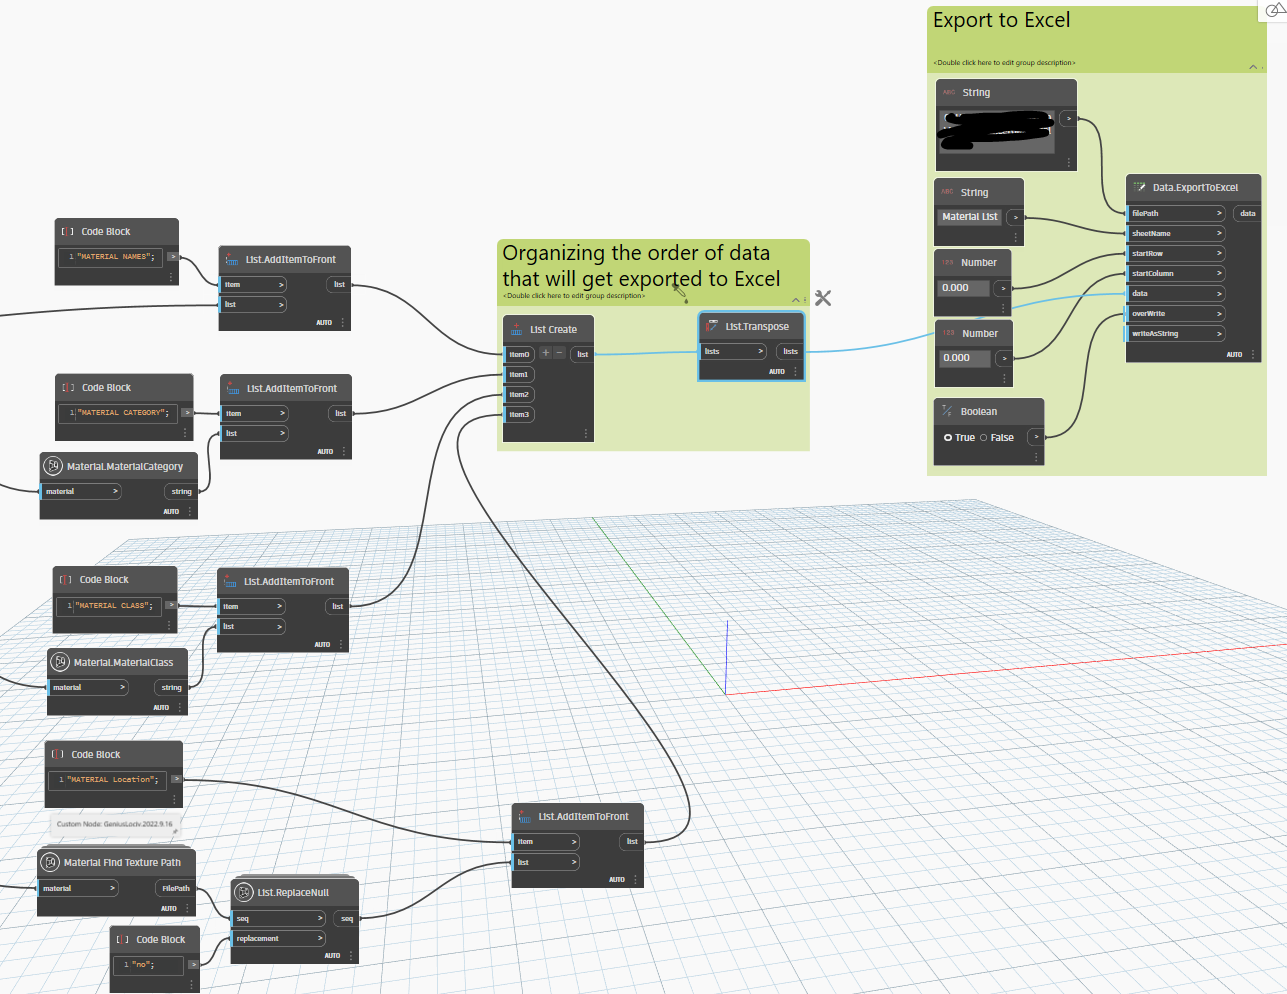
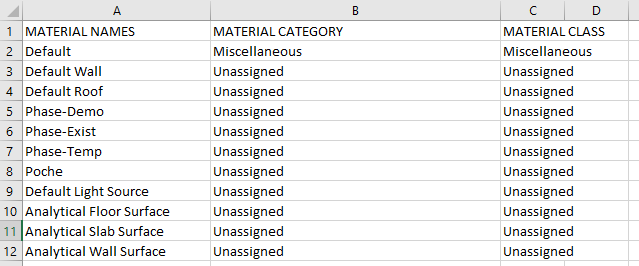
This is what I have
I basically want each column to include each set of data. so column A = Material Names, column B = Material Category, Column C = Material Class and Column D = Material Location.
Everything works well until Material Class / Column C since all dataset have the same format. However, when I add ‘Material Location’ to List Create, the Excel goes crazy where it would just flicker its window and the preview doesn’t have the right format of data.
I think it has to do with Material Location has data format that is not uniform throughout.
So how would that look in Excel? If a material has multiple locations would that be multiple lines for the same material? Would you combine all the locations into a single string?
I honestly don’t know how to explain this correctly but the excel sheet flickers in a wrong format.
WHAT I WANT (What it shows until Column C)
WHAT HAPPENS WHEN I ADD 'MATERIAL LOCATION (ADDING COLUMN D WITH MULTIPLE SUBLIST)

and it flickers 120 times with different dataset.
what you are seeing above is column 9 from the first image.
when I connect my Column D, it completely changes the entire excel format and it also flickers 120 times with each different value sets (I have 120 values).
It’s because you don’t have the correct format for your data. So Dynamo has to guess at the list structure to apply and ends up setting values multiple times using a different structure than intended. Ignore what it’s doing.
Each sublist in your dataset represents a Row in Excel. Each item within that sublist represents a Column. You cannot have more dimensions and you cannot have fewer dimensions because Excel is obviously a 2D grid of cells and each cell can only take a single value.
Currently you have a column/cell that has multiple values. You have to decide how you want to handle multiple values. The easiest options would be to either combine the values as a single string or to flatten the list and have one value in each column following the initial location. Another option would be to duplicate data so that each line only has a single value but would result in multiple lines for a single material.
Either way, your final input to Excel must be an
@L3 list.
Yes I think the example that you are showing above works!
For the Python Script, is there a node that I could use for that?
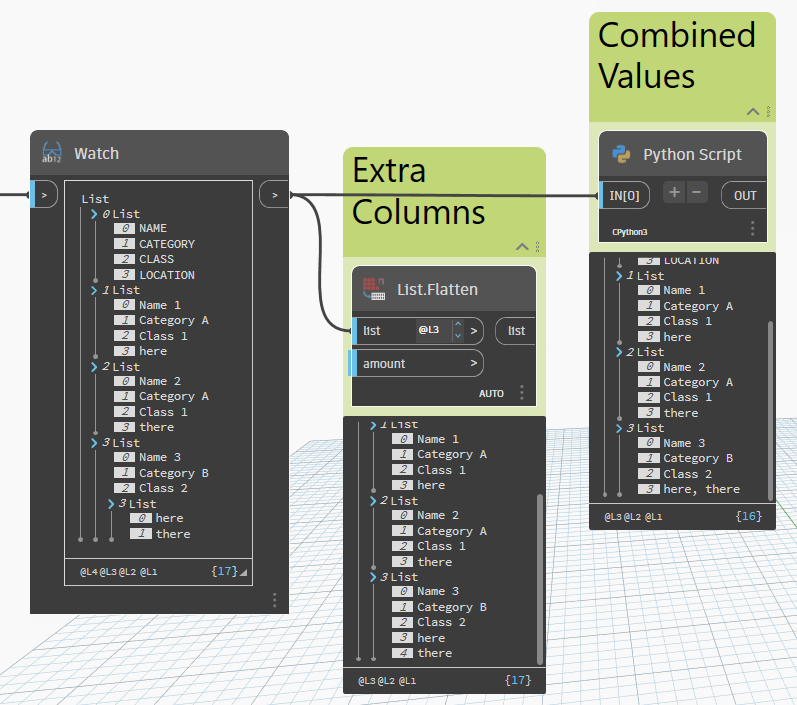
I see that the script is combining 3 List’s 3.HERE + 4.There into one.
Just want to be courteous about where I could find that node since I’m not sure if that script is private or public.
I just wrote something very specific to my example data to show you the output. There is not one single node that will fix this for you. You’ll have to continue your graph logic to take care of this issue.
In general terms, you need to get the values that can contain multiple values, convert those to lists if they’re not (add a list level and then flatten back to the intended list level), and then combine those lists of values as a singular string with String.Join.