Its been a while since I had to ask for help, so here’s hoping I can find something to help me. Have looked through some topics, but couldn’t find anything that looked similar.
Short version:
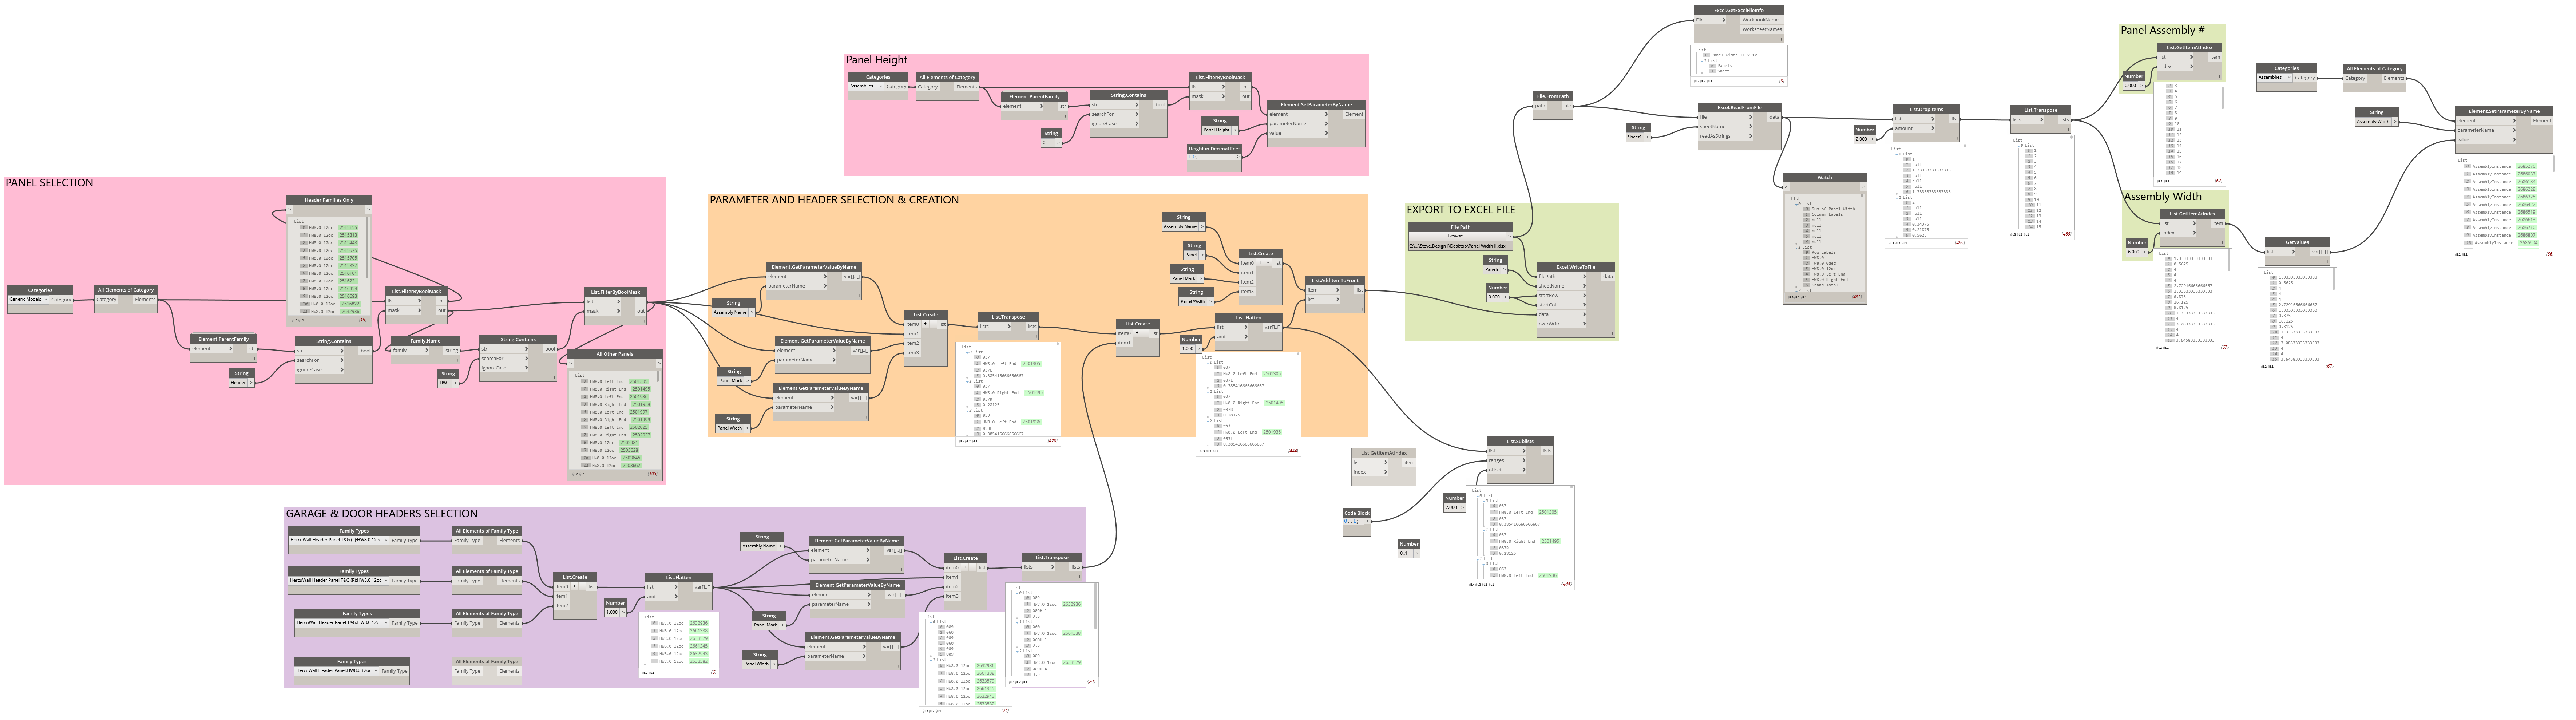
Pulling data from generic families (in Assemblies) in Revit. Exporting out to Excel. Adding data in Excel to get total length of families (in their respective assemblies). Taking length and inserting back into Revit schedule.
Have the graph completed. Only problem is that when I go to add data back into schedule it doesn’t line up with the right assembly.
So #1 is my filtered data from Excel which lines up with the Assembly number from Excel right! So when I go to put it back with Revit’s assemblies, #2, it messes up.
Excel formatted data.
Exported from Revit, panels are individually marked, gathered together per assembly type. This is used in pivot table on next sheet in workbook.
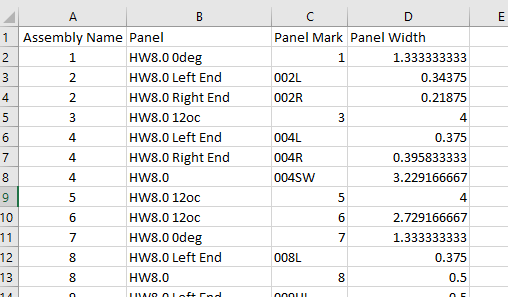
Pivot table then assembles panels together in rows and adds total length (decimal feet).
Once this completed it kicks the total back into schedule.

As you can see the width is not corresponding with the right Assembly type(panel ID).
Any help would be appreciated.
You’re going from elements within the assemblies to the assemblies, but there’s no way of knowing (with your current graph) which elements are part of which assemblies. You need to sort your elements by assembly and/or include the assembly ID in your exported data so that you can sort your assemblies before modifying their parameters.
So I need to pull the unique ids of the panels and associate them with
their assembly and its unique id? Sound about right?
Sincerely,
Steve Coburn - Senior Designer
Plant: 1045 S. Edward Dr.
Tempe, AZ 85285
Corporate: 1720 W. 10th St., Ste. 101
Tempe, AZ, 85281
Toll Free: 855.284.4037 ext. 1003
Office: 480.284.4535
Cell: 256.468.8277
Fax: 480.284.6535
web: http://hercutech.com/
That should do it.
Right now you’re getting a list of elements based on element ID and a list of assemblies based on element ID. You’d think the first element would go with the first assembly but that’s not necessarily true. You need a way to sort the elements by their assembly so that you can feed the correct element values into the correct assembly.
Got it. Appreciate the tip. Will work on it some more and see what I can get.
Nick, So my first try at it got the info I needed but it is not lining up even within the same list.
I pulled the assembly name and element id out so I could make sure they were matching up. Going back and forth between revit and the graph I found that they are not. Once I figure this matching issue out I can align this with the over all graph and add it to the right location to get the elements with in the assemblies to correspond with their assembly. Right now Excel is seeing multiple elements within the same assembly as different assembly IDs.
Or does each panel get a different assembly element ID when assembled? That would make sense. The revit assembly element id does not match. I’m going to hit it again in the morning.
Well you’re sorting the values before you transpose them, so you’re just re-ordering each list again. How do you want the coupled values sorted in the end?
Well List sort may not even need to be used. I was trying to get the IDs to match with the Names. Once that was done I can use the same process to do my separate panel ids with the assembly ids. This is the main problem I believe. Once I figure that out I can find out where in the process, previous one, I need to insert it so that it all matches up.
It may not be a problem, but I’m seeing two different Assembly IDs for the assembly 37 in the first two lines of the excel sheet and the following assemblies. I would think they should be the same.
The IDs already do match the names. Sorting them sorts each list separately and actually mixes them up again.
Try attaching the Element.Id and Element.Name nodes to their own List.UniqueItems node and see if the counts are the same for each of them. That will tell you if they’re all unique or not.
Okay, so I’m back at work on this graph. Are you stating to insert the list.uniqueItems node between the Element.ElementType node and the Element.Id and Element.Name nodes? If so they come up with the same data, qty, etc. . .
I took out the sort node and left the transpose node to combine the Assembly name to the Id.
There is one slight problem I’m seeing from the revit side. The element Id for the assemblies is being transposed (modified) by one digit. Here’s an image of what I’m seeing and not sure if it is a problem. Please reference the image above for e.g. Assembly 003 Id 2685277, 005 and 006.
Revit image of 003 Assembly Id.

Assembly 005

Assembly 006

So I will assume that Dynamo should be pulling the same info that Revit displays. Why is this not the case here?
When I search by ID this is what I get input is 2685276

When I search with 2685277 this is what I get

Could this be a problem?
I think I’m on the verge of solving this thing so any help is greatly appreciated. If there is something to get the ids to align then I’m not aware of it. Let me know if the whole graph is needed again. Nick appreciate it!
You want the List.Unique after Id and Name. This is just a check to make sure that each element has a unique name. The number of (unique) Ids should equal the number of (unique) Names. I honestly don’t remember why exactly I thought you should check this but if they don’t match there’s probably a problem.
I think you just need to remove the List.Sort node. I’m not sure how your Excel file is sorted, but you want to keep these sublists matched up with their elements.
EDIT:
If you get the elements and the assemblies separately there’s no way to tell which element belongs to which assembly. You need to get the elements from the assemblies so you can keep all the parameters tied together.
Nick, which package contains the Assembly.members node? That might solve a lot of my issues. That’s the very first thing I am trying to do and would combine all my list that I have in this graph.
Here’s an updated graph of what I have so far.
Sorry, I forgot to mention that. It’s from Clockwork.
1 Like
So Nick, since the notice of that Node I have reworked the graph to see if I could do it differently. I have what I need in data/list format so it is working.
I have one problem and I don’t know if you have run across it or not. Short story, a list/search is not pulling in one (many similar) items even though it states in the search that it is true and can be seen. Images should help and hopefully I can describe what is going on well enough for you to understand.
Pulling element’s parameter “Panel Mark” panel #014 is in question. Panels aprt of theis assembly are 014L, 014R, 014S, 014H - all seen here together.
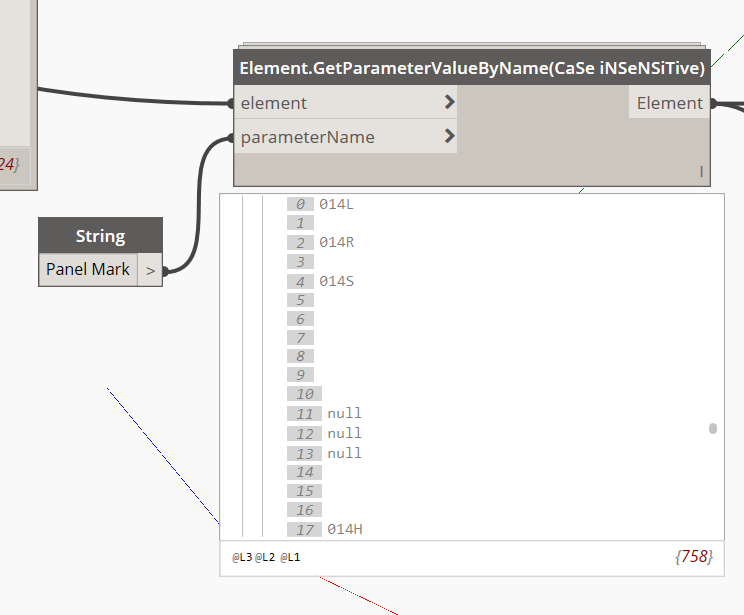
Filtering by BoolMask for only indexes/Panel marks with “0” (zero). This will allow me to pull just the panel marks of the members.
String contains shows all four members as true.
I remove the nulls - still show all four as true
Filter takes out 014H and moves it to the second list, but you can clearly see a spot at index #3 where it should be, and my watch for those I want to keep shows it missing.

The reason I noticed this is because of the list I am making with both the width of each panel and their mark has some holes.
I’m not sure if I have the levels correct, but this is the only way I could get them to show up.
If you have any suggestions or if anyone else know whats going on I would appreciate it.
Removing the nulls means you are left with 622 booleans to mask over 758 elements - so your lists don’t match anymore.
You can either use List.RemoveItemAtIndex to remove the items from your list of elements that had a null value or you can use Manage.ReplaceNulls to replace any null values with a false so that they don’t get included in your mask.


