So for the past few years I have been using Data Shapes to make it easier for all my team to use the Dynamo graphs I’m writing for us. With the updates to the Dynamo Payer in Revit 2023, I would like to stop using Data Shapes and just use the Player. Currently I’m having issues with the Data Shapes package and I just don’t want to have issues down the line with further updates if I can avoid it. Here are a few questions I have:
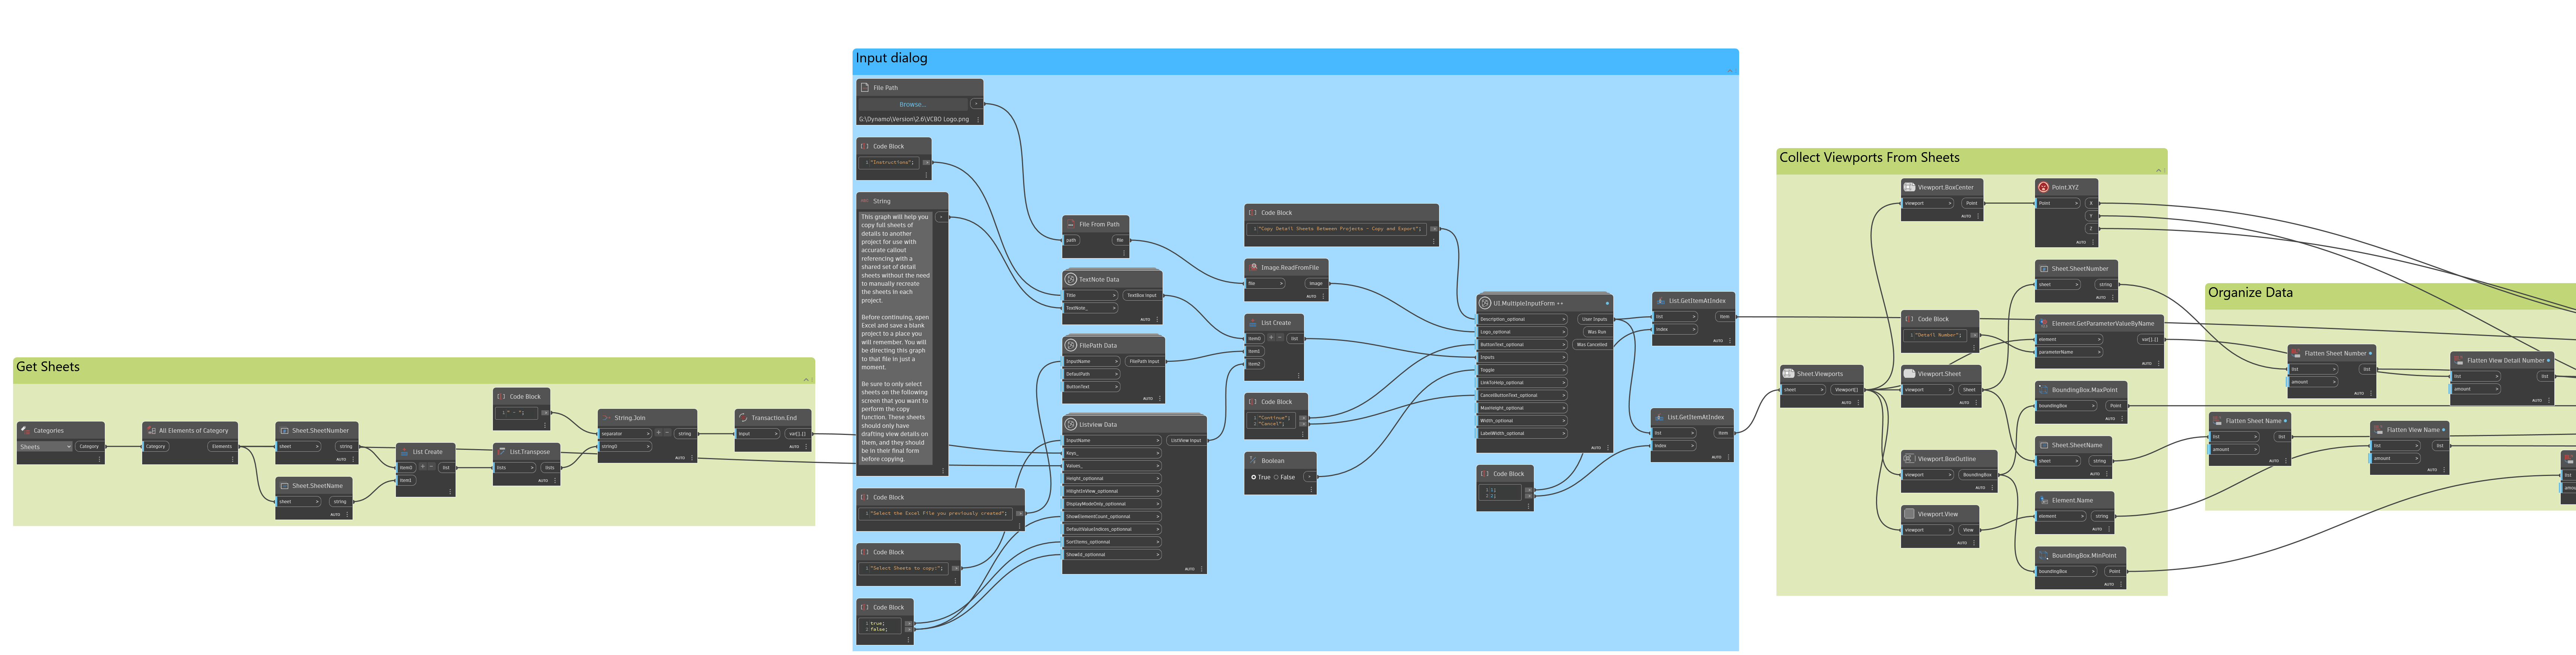
Is there a was to show a list of options for input where a user can select one or multiple items for use in a graph (i.e. selecting multiple sheets to modify)?
How do you edit the the description that shows for each graph on the Dynamo Player?
How do you edit the thumbnail that shows for each graph on the Dynamo Player?
How do you edit the Details link for each graph on the Dynamo Payer?
I really liked the versatility of Data Shapes, however I frequently run into issues with it and it looks like it’s having problems with the most recent version of Dynamo. Thanks for your help everyone!
There is a dropdown for an input now, but you have to add items to it manually, one by one. There is still not a native drop down or list select that would work with a a list of elements.
As for selecting sheets or views in the browser you can use the Collect Current Selection (not sure about the exact name of it right now) from spring nodes
In the past I have had issues with Data-Shapes just be inconsistent. Most notably lately is sometimes all the inputs are on the same initial window, sometimes they are in separate windows that open one after the other.
The other issue for 2023 was my own problem and I thought I was using the most updated version of the package and I was not so that’s bee resolved.
It very well could be. Is there a different way that you would suggest for me to write this part to make it all show in one window instead of three different ones?
In Revit 2021 and prior, it would always show in one window when I had multiple inputs, but since 2022 through now, it does both even though the graphs are organized the same way and I don’t know why. This does make it different when trying to pull the lists from the user inputs because when they are all on a single window I would use index 0 to get Item1 form the inputs (basically the TextNote Data didn’t get added to the list), whereas I need to us index 1 when they are in different windows. Nothing difficult but just inconsistent.
You can instead just use a code block to combine the sheet number and sheet name directly.
There was also a version change at one point that cause the MultipleInputForm++ node to handle L2 lists differently. I don’t think this is that issue and you’ve already upgraded to the latest version, but worth mentioning if this doesn’t fix the issue.