Good morning everyone,
I have a group of lines that have the same points but some of the points values are reversed. I want to correct this so the groups start point and end points are aligned.
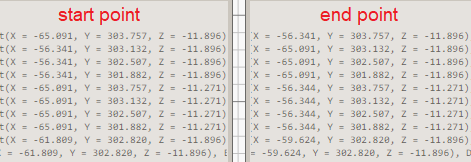
In this screenshot see how for index 0 the start x is -65 and end x is -56 and for index 1 this is reversed?
Is there a dynamo script or python script that could test which ones are reversed and swap the start point and end point so the groups start/end point data is aligned?
I’m attempting to solve this issue now through python script, will update with results.
Please let me know if you have any questions. Thank you for any help in advance!
can you provide a data set to test against? My guess is that it’d take longer to rebuild your current state than solve it. 
Jacob, thanks for your response!
Yes I can. What is a good way to export line data that I’m pulling from elements? Trying to figure out now
the Remember node in Refinery would work - select a handful of elements and wire it in, save the graph, disconnect from the remember node, save the graph again, delete everything but the remember node, and attach the file.
Other than that, upload your graph and any necessary files to recreate a small section of the file.
Jacob,
Attached please find revit file & dynamo graph.
reverse start end pt.rvt (828 KB)
Reverse start end pt.dyn (9.5 KB)
For now I have solved this issue through this code
However, this will only work for lines that share the same X. I will need to update for lines that share the same Y, and have a solution for diagonal lines. Will have to find specific examples for those two instances.
Marcel,
Nice find! However, when using within a script I get this error

Doesn’t seem to return a line object and stays a function?
So for now I will use the solution I posted above.
You can also compare the converted string.
2 Likes


