Is there a way to save data as HTML table?
Or
Save a Excel file as HTM page after the creation of the Excel file?
Is there a way to save data as HTML table?
Or
Save a Excel file as HTM page after the creation of the Excel file?
I didn’t know PyRevit had such an option, but i doubt it can do what i need / am after.
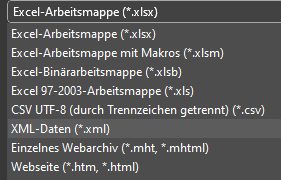
I know you can save a file as .htm / .html in excel, but you have to do it manually.
I cam across this post on https://bimextension.com/.
I found all that pretty interesting and more like what i am after, but the post is fairly old.
I am not aware of a fully supported package for generating the full HTML, but it certainly could be done.
That said, without knowing more of what you’re after generating we can review options from there. My guess is that it’d be easier/more scalable to build the HTML once, and pointing at the right dataset which you export from Dynamo rather than building the full HTML each time.
For now i am just exploring possibilities ![]() .
.
In short i want to export data per Family Type and save that as an html page.
I want to create a address at the same time and put that in the Family Types url so you can
click that and you can see exported data in a browser / on the web.
Maybe in the future i wanna look into being able to change the data and get that into Revit
from the web.
Also came across this post, but this is also fairly old (2017).
But for now i just wanna be able to create a table for the web / as htm.
Would you want a view of the geometry as well, or just a ‘table’?
If geometry is also of interest, I recommend you move past Dynamo and look into APS (formerly Forge) as the capabilities you’re after are built into the tool and maintained by Autodesk directly. In fact the ‘intro’ tutorial for the viewer goes over how to do almost everything you’re after with nearly no customization involved.
If you want geometry but you are APS adverse you can look into rebuilding the wheel on your own, but it’s a BIG lift. Perhaps something could be done with one of the js based IFC readers. You’ll need some web coding experience for that.
And the last option is the geometry-free version, where you build an HTML template, select an instance/type via the drop down, and a chart is displayed. All of the data which is exposed could be populated by running a Dynamo graph, but you’d be limited to text display without getting much deeper (see the two proceeding instances).
For now just tables.
In which case consider the APS or base HTML setup. Write your HTML in any tool, and setup the dropdown to populate from a list of CSV file names, and the table to populate with the data from the file. Dynamo can then build the CSVs directly and easily. You might even be able to do this with just a power BI base and scrap the HTML need.
Hi,
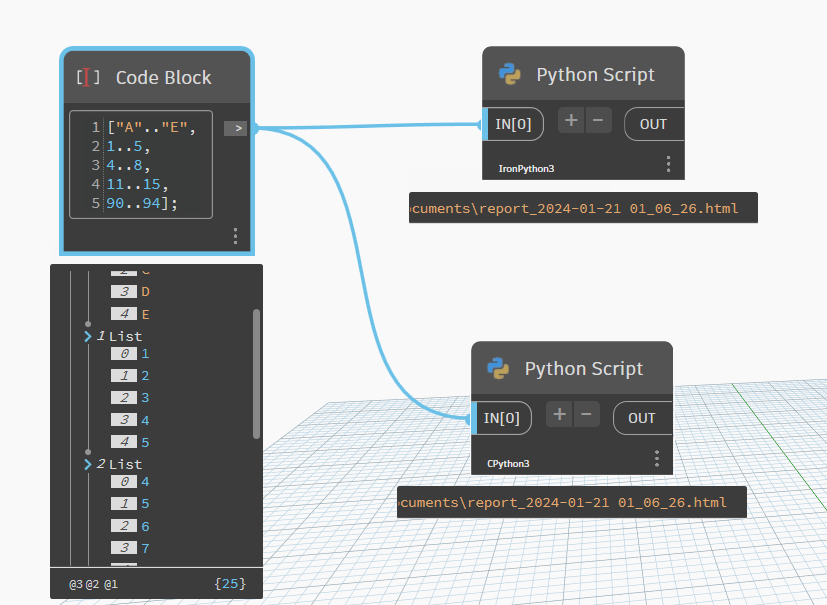
examples with Python
import clr
import sys
import datetime
import System
datenow = datetime.datetime.now().strftime('%Y-%m-%d %H:%M:%S')
exportfolder = System.Environment.GetFolderPath(System.Environment.SpecialFolder.MyDocuments)
reporthtmlfile = exportfolder + "\\report_"+ datenow.replace(':','_') + ".html"
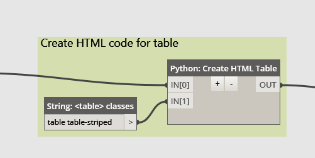
def array_to_html_table(array_datas, out_html_file):
htmllst = []
htmllst.append("<html>")
htmllst.append("<table style='width: 70%; border-collapse: collapse; border-style: double; margin-left: auto; margin-right: auto;' border='1'>")
for sublist in array_datas:
htmllst.append(" <tr><td>")
htmllst.append(" </td><td>".join([str(x) for x in sublist]))
htmllst.append(" </td></tr>")
htmllst.append("</table> </html>")
with open(out_html_file, 'w') as f:
f.writelines(htmllst)
array_datas = IN[0]
array_to_html_table(array_datas, reporthtmlfile)
OUT = reporthtmlfile
import clr
import sys
import datetime
import System
datenow = datetime.datetime.now().strftime('%Y-%m-%d %H:%M:%S')
exportfolder = System.Environment.GetFolderPath(System.Environment.SpecialFolder.MyDocuments)
reporthtmlfile = exportfolder + "\\report_"+ datenow.replace(':','_') + ".html"

import pandas as pd

array_datas = IN[0]
df = pd.DataFrame(data=array_datas[1:], columns=array_datas[0])
df.to_html(reporthtmlfile)
OUT = reporthtmlfile
This is great! Thank you so much for this!
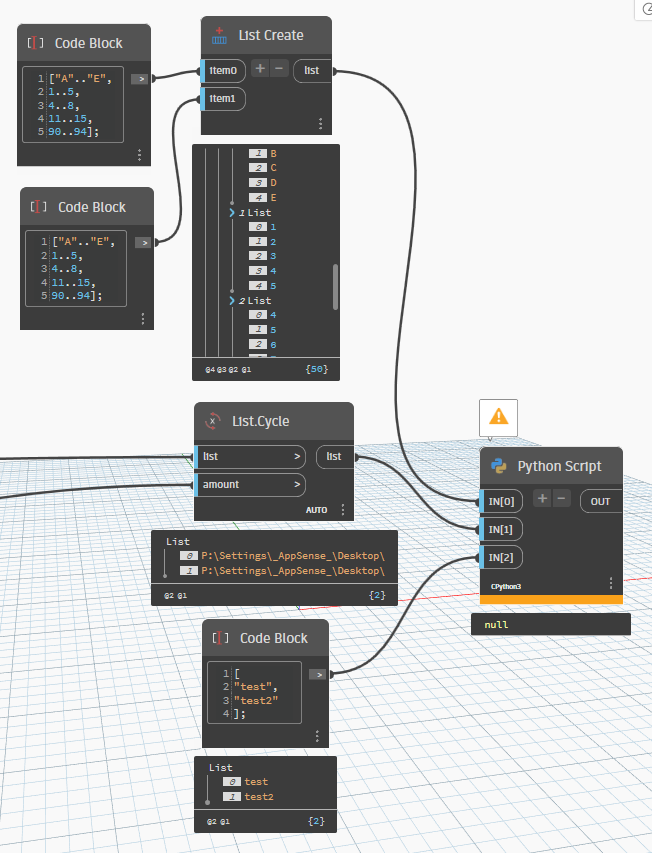
What do i have to change in the code so i can create multiple tables with a different paths/ urls
for each table? Or isn’t that possible?
My end goal is to create x tables with x url is one go.
Convert the python into a custom node. You can use list of paths etc.