We’ve been trying to write a graph in which we want to compare the ducts in our Revit model with an Excel list.
When the dimensions of the ducts in the model meet the conditions in the Excel list a keynote has to be returned to the comments field of the specified duct in Revit.
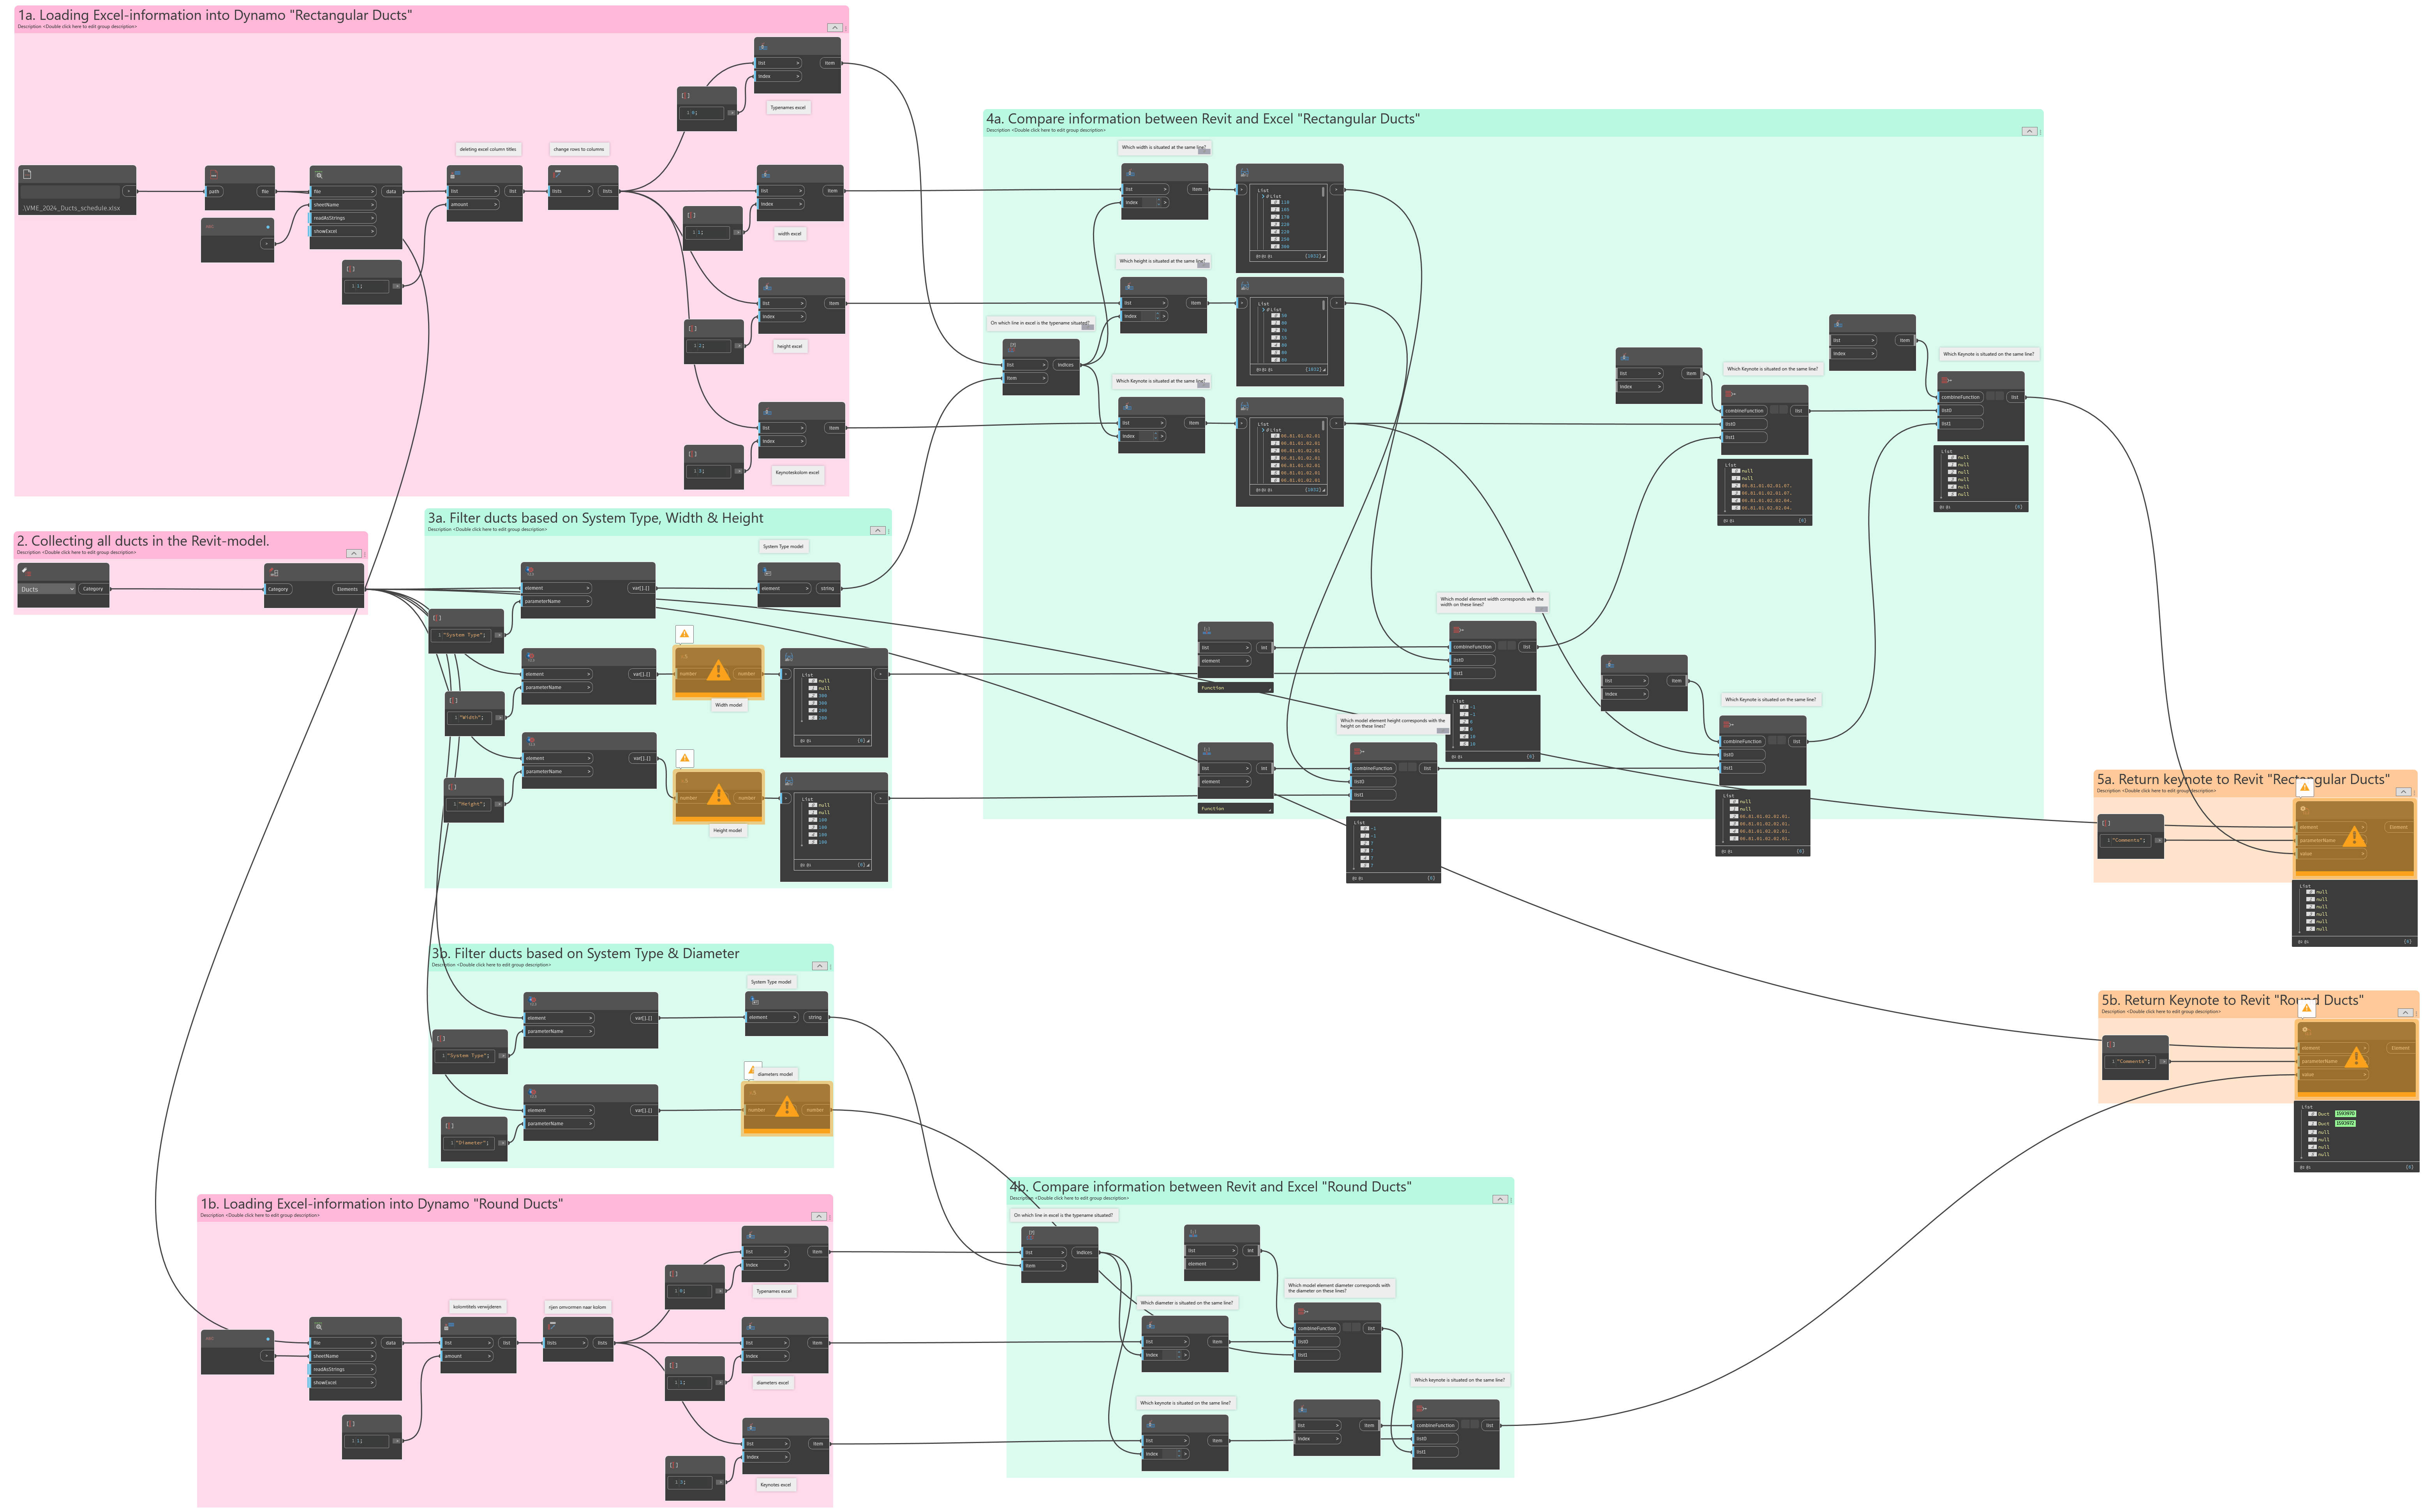
The graph consists of 2 parts;
rectangular ducts (a numbering in the group titles, or the upper part of the graph)
round ducts (b numbering in the group titles or the bottom part of the graph
The round ducts work fine, here only 2 criteria have to meet, system type and diameter.
The part where we struggle are the rectangular ducs where 3 criteria have to meet, system type, width and height.
Underneath the part where we think it goes wrong.
not the whole list gets compared, it stops at the first result?
example width for line 2 and 3, at position 6 we have the first time the corresponding width in the excel list, but we have at more positions.
Added underneath, our excel file and a link to the Revit file.
Thanks for updating with files and a clean screen shot with titles
Your task is fairly straight forward, however I would argue that Dynamo does not make it easy as there is going to be a lot of list level manipulation to achieve a result
Your excel data has a lot of duplicate keynotes and they align with height and width (or diameter) so you can effectively remove one layer of choice… except here where you may have to check for oval ducts (plastic or metal) - there isn’t enough information to resolve
You can use nested dictionaries from python which can be simpler - please note that as some versions of Dynamo append six zeros to the end of a string integer I have adjusted for that
rect = IN[0]

rect_dict = {}
for duct in rect:
    if "metaal" in duct[4]:
        (
            rect_dict.setdefault("{:.6f}".format(duct[1]), {})
            .setdefault("{:.6f}".format(duct[2]), duct[3])
        )

OUT = rect_dict