Hello all,
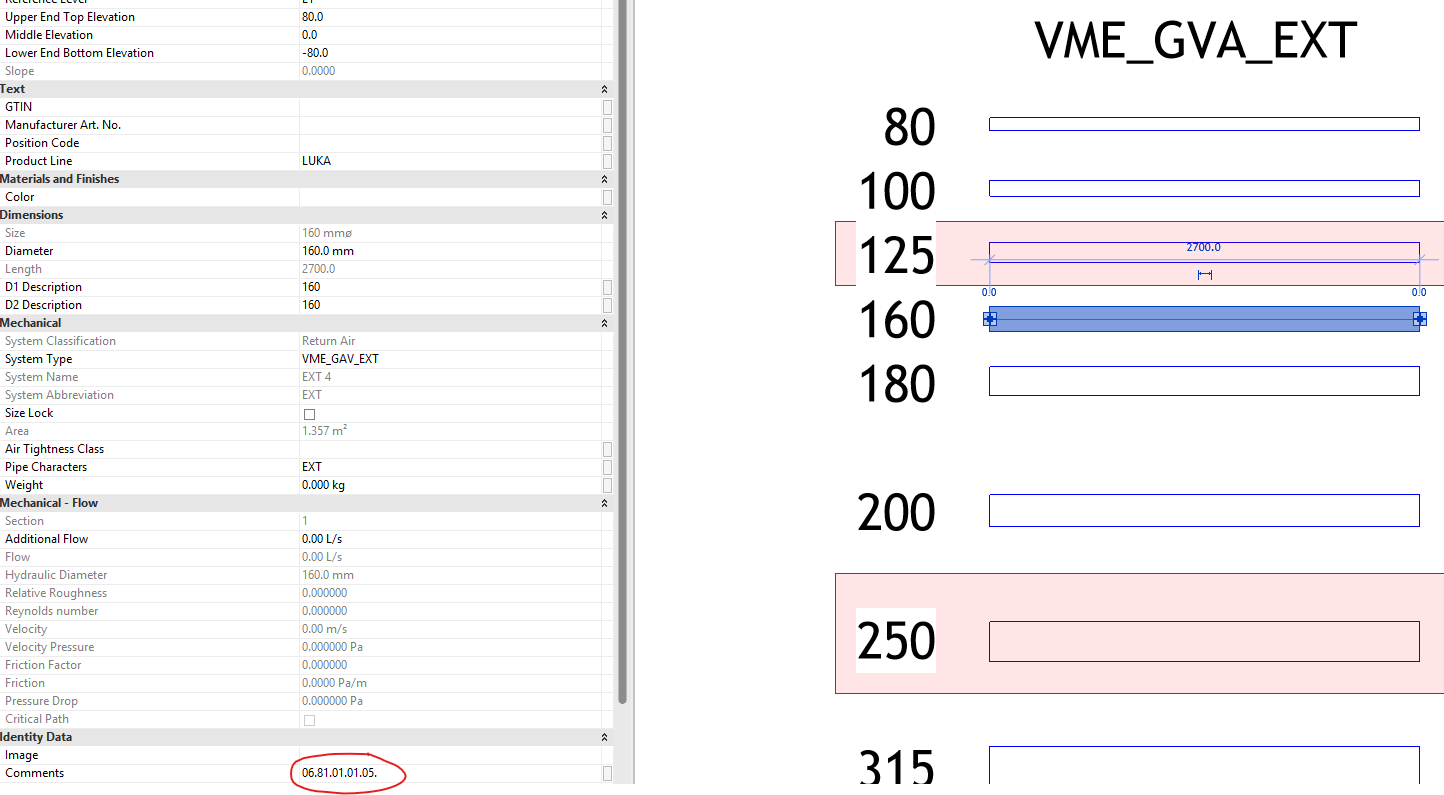
We are using a graph to write keynotes to the comments parameter of ducts that we have modeled in our project.
(the graph was made with help from the forum, link to the original post)
This was working fine for us, but now we noticed a problem with the round ducts of which we cannot say with certainty if the problem was already there from the beginning. The graph works as follows. Ducts in the model are filtered / grouped by shape.

Next we collect the information from our excel file, diameter + keynote and both go into a list.

Diameters in the excel and Revit model are compared which results in the corresponding keynote.
However, 6 out of the 16 diameters give a -1 result in the List.IndexOf node. So there is no return of keynote to the parameter in revit for those 6 ducts.
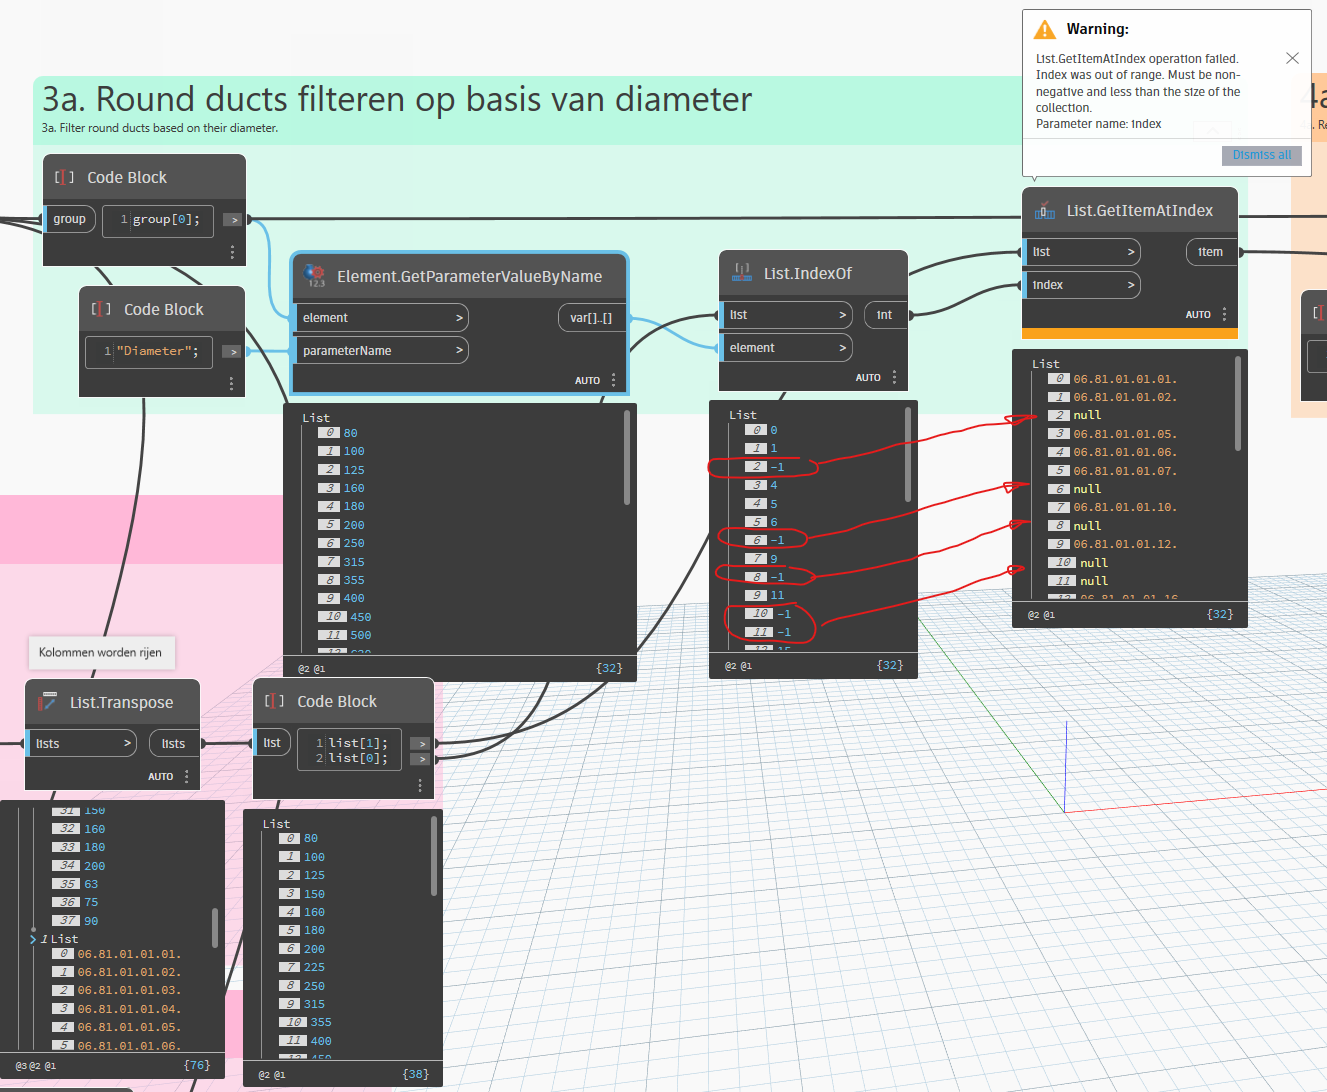
Can someone explain why those 6 diameters give a -1 result int the List.IndexOf node? and help us further on the way …
We have already swapped the position of the ø 25mm in the excel list with the 160mm line, but the result stays the same.

Diameters that give the -1 result are; 125mm, 250mm, 355mm, 450mm, 500mm and 1000mm.
Underneath the full graph, the problem only situates with the round ducts, upper parts of the graph (first 2 input groups).
There are no oval or rectangular ducts in the added revit file, hence the exclamation marks, input of a no existing group …

Link to the Revit file + Graph + Excel file, available untill 20 january.
Thanks by advance,
Kind regards,

