Time 

Thanks!
I also manage to do this:
import time
tiempo = []

tiempo.append(time.time()) #several times (all needed)

tiempo_final = []
for t in range(1, len(tiempo)):
tiempo_final.append(round(tiempo[t] - tiempo[t - 1], 4))I had a couple of minutes spare (I know, when does that happen) so I put together an Audit node for .dyn files.
I intend to have this as part of my first package publish (a few weeks away yet) hence the node naming, so expect to see it there also (with some further optimization)

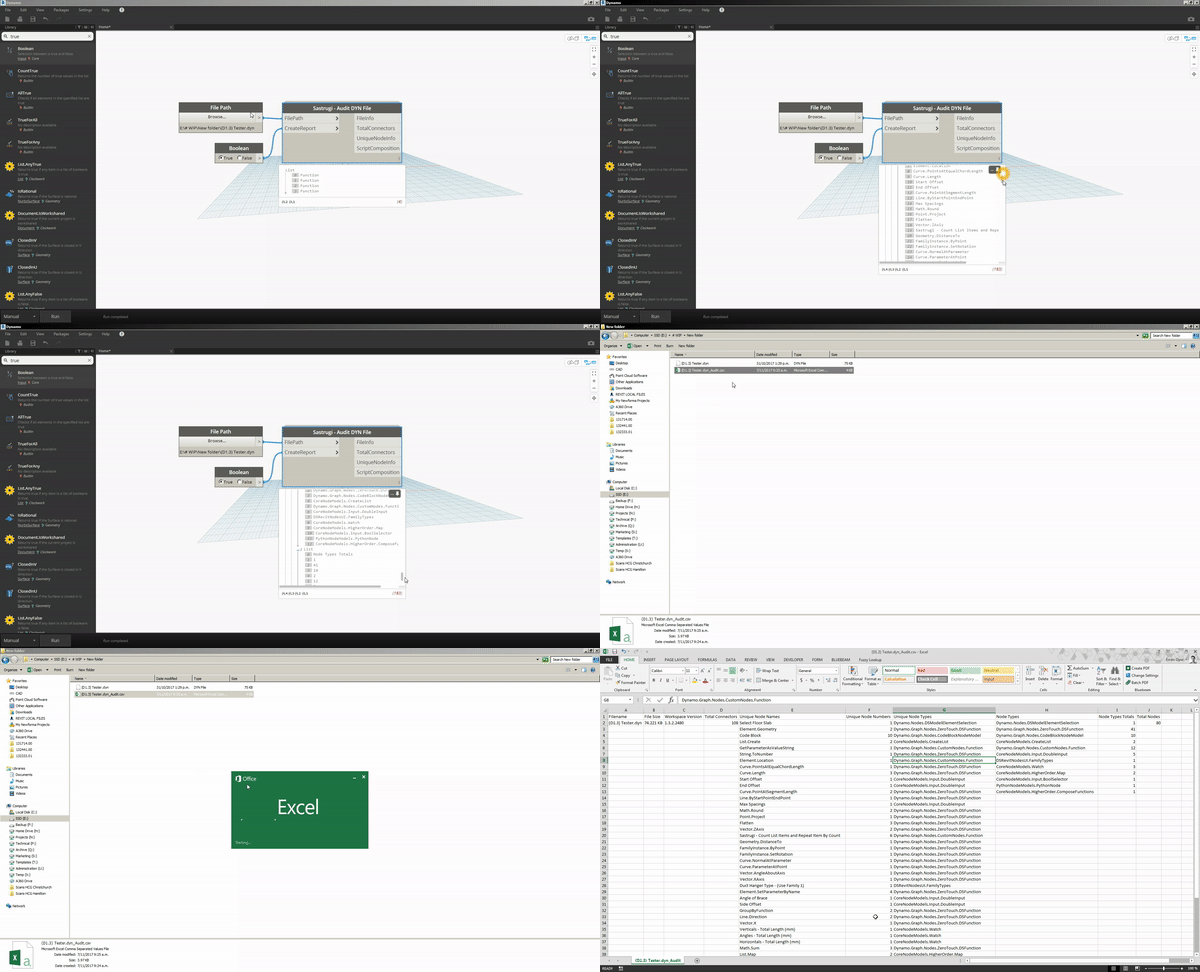
Inputs/Options:
- File Path (DYN)
- Create Report (CSV file in the same folder as the script)
Outputs:
- File Info (Name, Size, Workspace version)
- Total Number of Connectors
- Unique Node names, types and numbers of.
- Script Composition (Node types, numbers of and total)
I am thinking when used in conjunction with time tracking shown by @Kulkul and here How to measure execution time for nodes? - #4 by Andreas_Dieckmann this may form a starting point for thoughts on how to optimize a script.
In case you are wondering "Sastrugi=parallel wave-like ridges caused by winds on the surface of hard snow, especially in polar regions."
EDIT/UPDATE: A revised version of this node can be found here, until I am able to publish my package.
OMG! NIce work @Ewan_Opie
@Ewan_Opie, I tried your node, but the output file is almost the same. COlumn structure is different. I have all the information in the column A of the CSV File.
Hmm not ideal, can you post a screenshot?
I managed to get it orginized as you have in your image, but I needed to import from text, not just open the CSV file.
How did you open the csv? Did you drag the file into excel? or open it using a double-click?
I am trying, and failing, to replecate this error… 
The first time, Double-CLick. The second imported from the Data ribbon.
Can you post your dyn?
Sorry, I can’t due to my office’s policies. This is the actual dyn that we’re developing. I tried with another script and had the same result. For me, it only works if I import the CSV file from the ribbon in a blank sheet. Maybe it is my Excel configuration.
All good, I understand.
It very well could be Excel… at least you have a work around.
I may include the option of exporting to different formats (TXT,CSV and XLS) in the final node configuration.
If anyone else encounters errors please let me know, would be nice if my release goes smoothly 
The biggest reason for slowing down is the way the graph is created.
I can understand that causing an issue during the execution of the graph, but not after it’s over and after Dynamo has been closed.
I believe that this is because the data associated with running the Dynamo node is still stored in the ram so that it can be undone. Hence the save/sync clearing things up.
Then you’d expect RAM usage to be quite high, yes? That’s not been my experience.
Believe that much data would go directly to the scratch disk.
I think you can easily test this by opening workshare monitor and then the “system performance” popup and watching the various components adjust as you run a script, close Dynamo, and not yet save.
that’s interesting - and if so would start to explain why others aren’t seeing the issue - this office doesn’t see the benefit to an SSD and if it’s being written to a standard hard drive instead you’d expect it to be slower - yes?
by workshare monitor you mean Autodesk’s tool, right?
Yes - look into the read/write speeds of your HDD. It’s a BIG difference.
Yes. It’s insanely useful for a lot of things and should likely be a core part of any teams workflow. Sadly stops working of your script uses any UI++ nodes from the datashapes package.
Blockquote
Sadly stops working of your script uses any UI++ nodes from the datashapes package.
Can you elaborate on this? We use this tool extensively and Data-Shapes is a nice package.
Marcel

