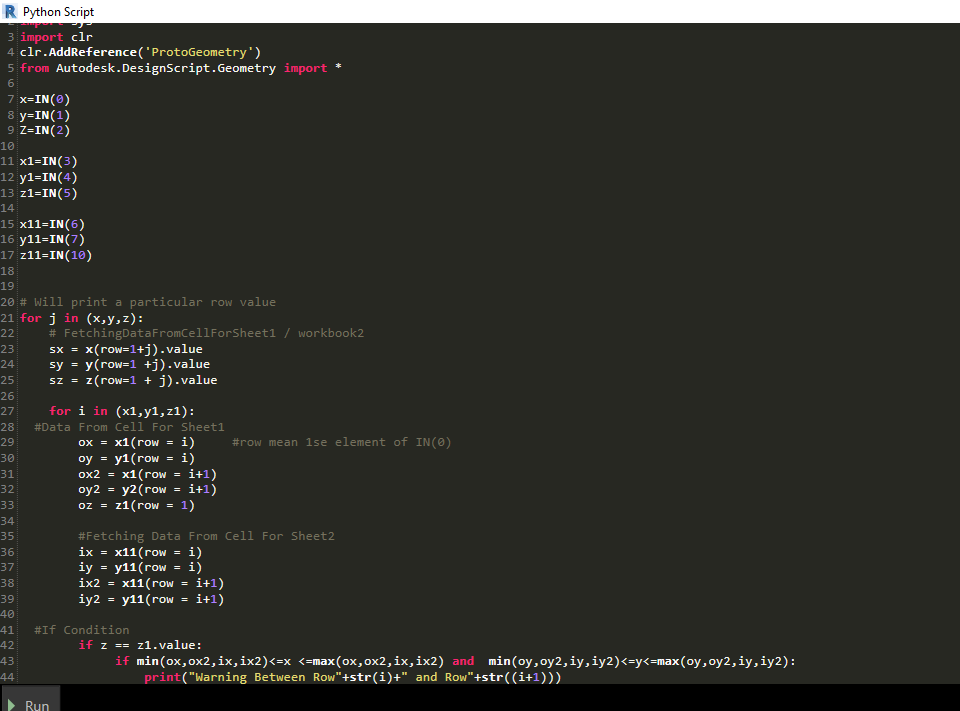
Hi. i am sharing my dynamo python code. i have scripted this code in pycharm but finding it really hard to write the same code in dynamo.
basically what I am doing is I have 2 sheets in excel that give me a range and 3rd sheet with values. I want to check that wether any row of the 3rd sheet is in the range of the first 2 sheets. I imported three excel sheets to dynamo and made a list of each column (3 columns of each excel sheet). i want to apply for loop so that each value is checked wether its in the range or not. but I don’t how to call each element of the list in dynamo python script to run the for loop.
roof edges+S.txt (1.5 KB) (the pycharm code that I want run in dynamo) s data.xlsx (7.9 KB) ( the sheet which is to be checked) coordinates.xlsx (9.2 KB) .( the two sheets to set the range)
i want to detect point with in a certain boundary. like whenever my any of the input coordinates (s data xlsx) are within those coordinates it gives a warning on revit
.
i have coordinates at the edges 1,2,3,4,5,6… (sheet 1 of the coordinates.xlsx) and the coordinates at the inner boundary ( sheet 2 of the edges ). sheet s data has multiple rows that i want to check that if any row has coordinates between the edges and inner boundary it should give a warning in revit ( print a warning in pycharm).
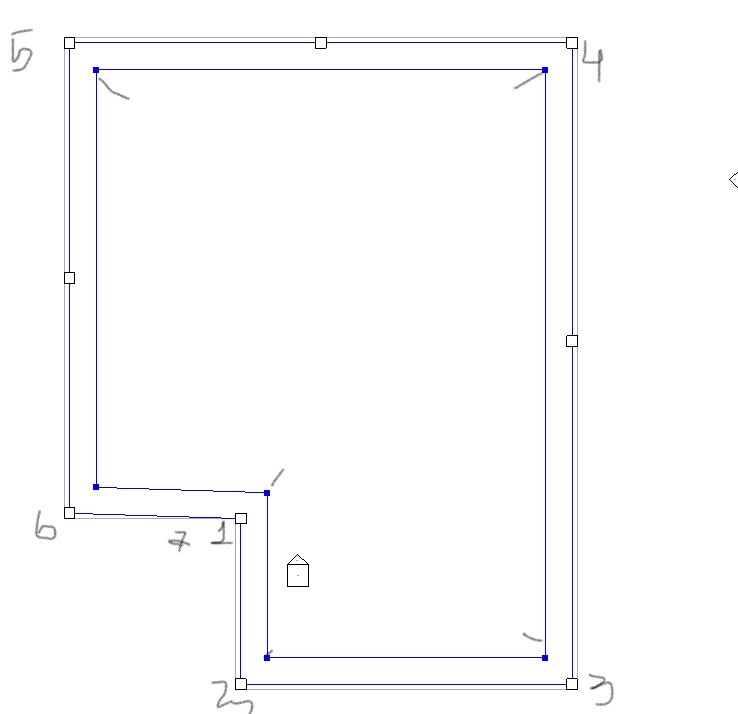
Like I mentioned, to detect if a point lays within a certain boundary is very easy to do in Dynamo without python.
Below you see the 2 boundary lines. I made an example on how to do this with predefined functions in Dynamo. You can also make it very visible with Red (Points lay between the boundaries) and Green (Points dont lay between the boundaries)
Let me know if this works for you. If you would rather do all this in Python, let me know and we will take a look at the code in Python.