Dear Experts,
is is possible to make interpolation to the values got from excel table?
Example:

inputs A=0.22
B=0.15
Result: 11.04
Yes this could work. Find the first value along the axis which your input is greater than. Then find the number above that. Then parameterize the space between to get the interpolation on the axis. Do this for both axis, and finally map the axis interpolation to the values in the chart.
Hi,
SciPy library has an interesting sub-package for this
https://docs.scipy.org/doc/scipy/reference/interpolate.html
an example with interp2d (linear kind) , there are several methods and options
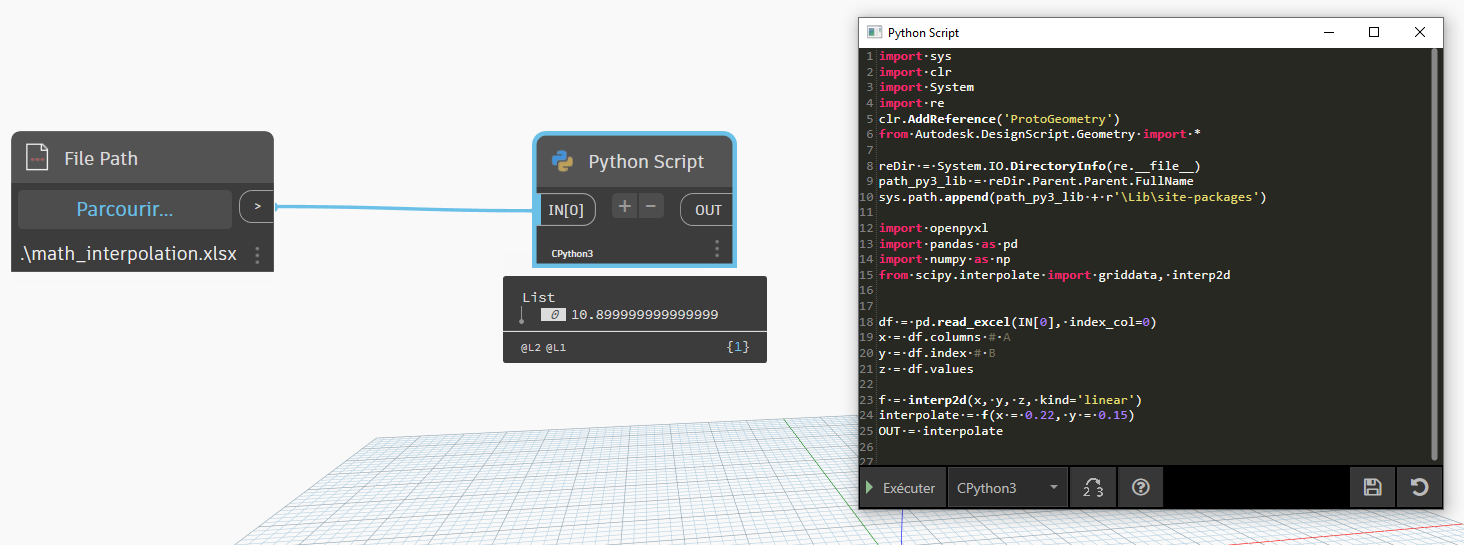
import sys
import clr
import System
import re
clr.AddReference('ProtoGeometry')
from Autodesk.DesignScript.Geometry import *

reDir = System.IO.DirectoryInfo(re.__file__)
path_py3_lib = reDir.Parent.Parent.FullName
sys.path.append(path_py3_lib + r'\Lib\site-packages')

import openpyxl
import pandas as pd
import numpy as np
from scipy.interpolate import griddata, interp2d


df = pd.read_excel(IN[0], index_col=0)
x = df.columns # A
y = df.index # B
z = df.values

f = interp2d(x, y, z, kind='linear')
interpolate = f(x = 0.22, y = 0.15)
OUT = interpolate
visualization of the interpolated point on the grid

8 Likes