I have began development of a script to extract data from an analytical software and want to map the results back into REVIT text parameters based off of matching XY coordinates between the 2 softwares. I am struggling with finding best method of get data mapped to REVIT.
My results from analytical software:
My results from REVIT:
Goal of script is to first match the XY coordinates between the 2 results, if coordinates match, then i would like to take the 1’s and 18x24’s from analytical software and map that data into text parameters in REVIT. Can someone help this new dumb guy to Dynamo?
Geometry is not directly comparable so you have to convert the points into strings or coordinate values. As long as your precision is enough to maintain all unique instances (which it seems like it is) your best bet is strings. In some cases it’s also good to round your values in case Revit and the external software don’t exactly match, but again, I think you look good here.
I did all that part. Issue is mapping the sublist data back into REVIT. I for the life of me can’t find best method to map it. I think i have the matching of XY’s down but steps after that i am lost.
It’s not really “mapping” as much as it is finding and filtering individual matches. The trick is to maintain the element list and the point list in parallel, so that whatever manipulation you make to the points, you also make to the elements. In your case, you shouldn’t have to do much. Getting the element locations and converting them to strings doesn’t change the order so you’re good there. Then you just have to compare the two list of points. Be sure to use list levels or lacing so that each Revit point is compared against each external point. Then it’s just a matter of applying a boolean mask on the elements.
I think i am missing something. I think i already have result you are showing but thats not what i am looking for.
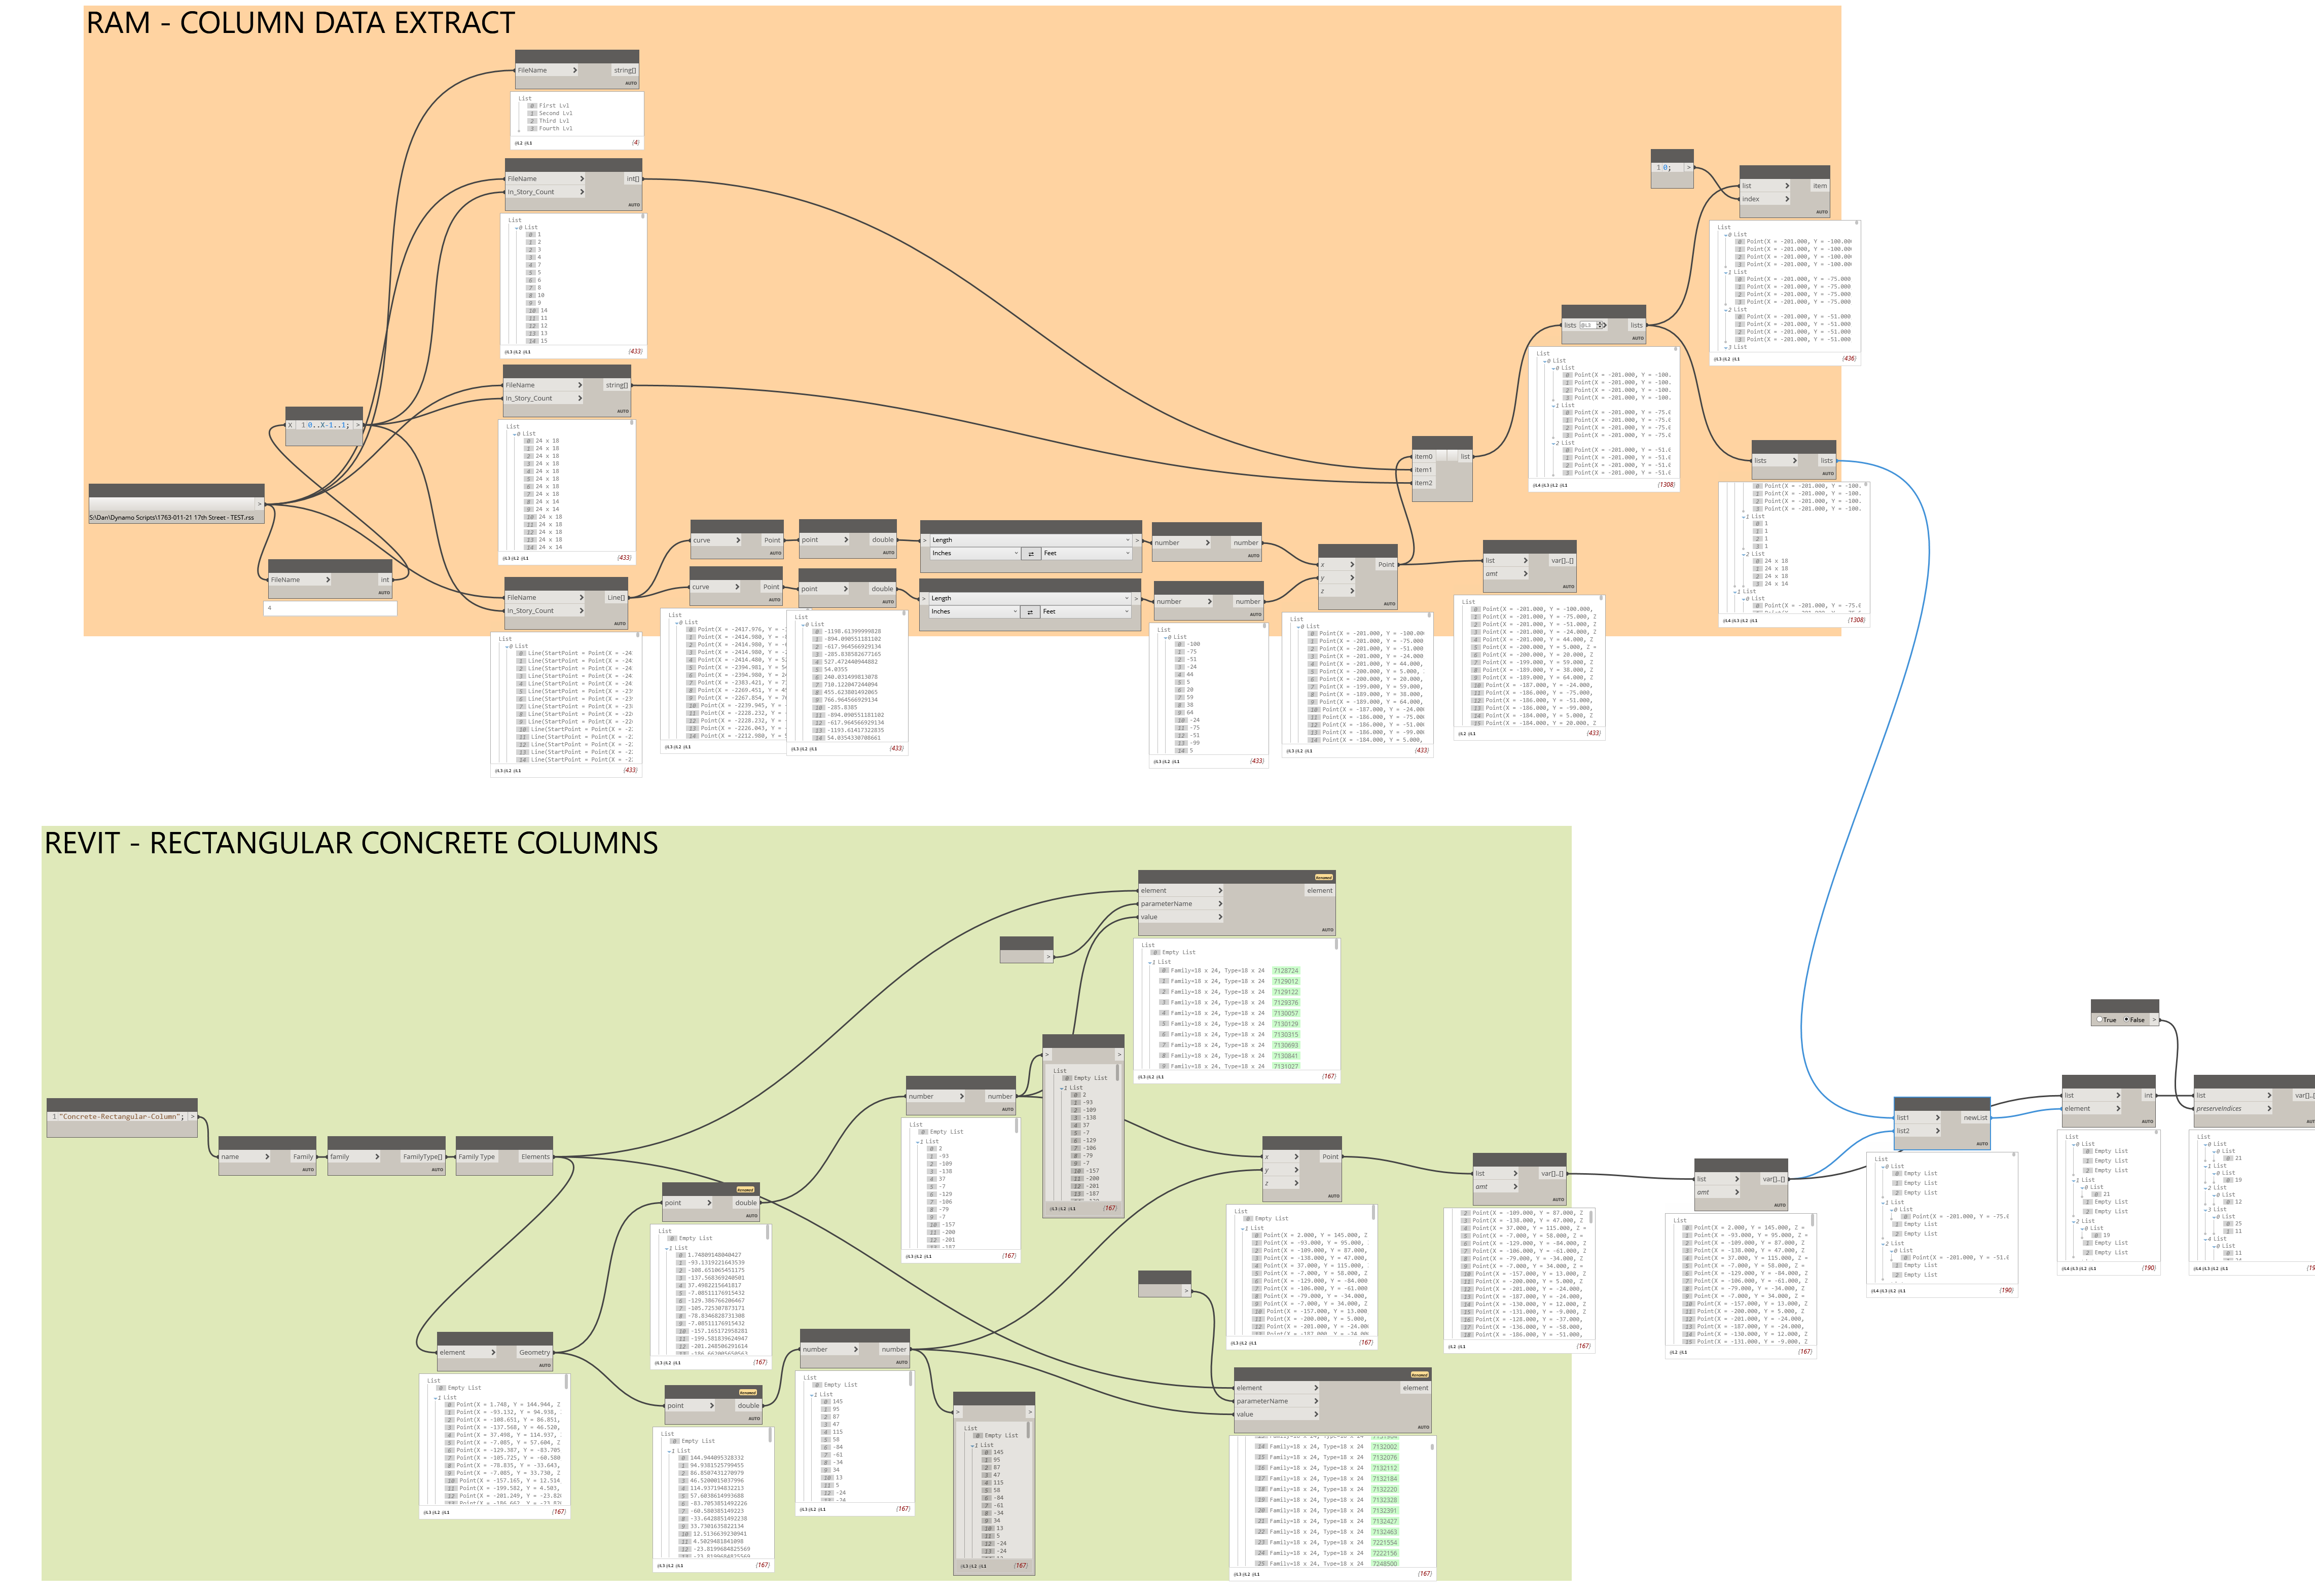
Here is my complete script. I also have attached the Dynamo file.
Column XYZ Coordinates - Sample.dyn (86.7 KB)
I am sure i am just dense here and not understanding what you are showing. What i want to do is pull the 1’s and 18x24’s into separate text parameters within REVIT column. i placed some nodes within example of end result i am attempting to get. i apologize for my lack of knowledge at this.
Your images aren’t legible so it’s hard to comment on what you have.
I’m assuming that your 1s list and 18x24s list match the external points list. Filtering the Revit elements based on their matching points with the external list should give you the Revit elements in the same order as the external list. That would mean that all the values line up with the list of elements so you could then just write the values to their respective parameters.
Data i am trying to get into REVIT from external list is shown below here. Currently what is happening at moment, is that nodes i have are extracting column numbers and column sizes from an external analytical software. Each column coming from external software is broken apart by level, hence the 4 coordinates, 4 (1’s) and 4 (24x18/14’s) for example. So in REVIT i will have a text parameter for each level where the data coming from external software will map to. Ultimately i want to get all the 0’s from sublist mapped to Level 1 in REVIT. Then all the 1’s from sublist mapped to Level 2, and so on. All with the caveat that the XY coordinates match from external software to REVIT. I am just at a loss and i apologize for being a pain.
sample of what i want to do at the end as i attempted to explain above.
So if I’m following you, the 4 points in each sublist represent the “same” column at levels 1-4. You have these same columns in Revit. If you follow the first steps of filtering the Revit elements by the matching points, then you should end up with 4 Revit columns as well. You may have to group the revit columns by key (the point value) so that they’re grouped into sublists. Then you just need to sort those elements by level.
Based on the image you’ve shown, I’m guessing your list structures don’t match and that your Revit list is a single list with no sublists. What does the error say? What does your element input look like?
It would be really helpful if you could post an image of your graph with all the node preview bubbles pinned. Make sure you’re zoomed in enough that the nodes are all legible (they don’t all have to fit on the screen, the node title just has to be visible) and then use Export as Image in the top right of the Dynamo window to export the entire workspace.
Sort of. In REVIT there is one continuous column (in this case, running 4 levels) from top to bottom, where analytical software breaks it down by Level in turn giving 4 “columns”. This is just a small model i developed to test. In reality we may have a column which is 30-60 stories in height. So currently external software is giving me 4 item sublists, where REVIT column nodes i have are just extracting the XY coordinates.
First two are analytical software:
Next two are REVIT:
Full script:
As i mentioned. Ultimately the data from external software sublists, gets “mapped” to REVIT text parameters based on matching XY coordinates. In our sample case, all the Sublist 0’s would be mapped to Level 1 text parameters in REVIT, Sublist 1’s would be mapped to Level 2 text parameters.
Maybe this would explain my goal a little better. I just need to know how to get to making it all work.
Having unmatched lists between the external software and Revit is making this overcomplicated and probably slowing you down significantly. Get rid of all but one of the 4 column points in each sublist so that you’re comparing points 1-to-1 for each column. You can keep the sublists for number and size.
Once you have the boolean list for matching points you can apply that to the element list so that your column data matches the order of the Revit columns and you can apply all the parameter values directly.
It’s probably best to transpose your parameter data at this point so that each sublist represents a single parameter/value rather than all four parameters/values per column. It’s just easier to handle the list levels that way.
Thank you sir. I tried to do something similar to this prior but i couldn’t get the CodeBlock after the transpose to give me a “list” of lists. Anytime i typed in List into the CodeBlock it would give me an error (List is a class name, can’t be used as variable). What code did you type in there to get that list?
Again sorry for being a pain, but for some reason no matter what i typed in CodeBlock it just gave error. The rest of what you have makes perfect sense and I thank you so much for the help.
Capital List is a class. Lower case list should be fine, but honestly is bad practice on my end anyway. I just use it in examples because it’s easy to follow. In this case, list is just the variable name of my top level list that I’m separating into sublists. You can use any name you want.
I did not know that part with the letter capital or not. So i have basically copied what you have done yet i am not getting correct results. As soon as i get to the == the script fails and is showing everything as false telling me no points match, which is not correct.
If i use a set.intersection node, i get a whole list of coordinates which match. I am not sure what is going on and why its showing everything as false.
As I mentioned before, you’ll want to convert the points to strings so they’re comparable at that step. Different kinds of comparison are limited to different object types. Direct item comparison with == will not accept geometry.
EDIT: You also seem to be adding an extra list level with those python nodes. What’s the reasoning for that? It may change how the lists are being handled and is confusing and unnecessary at the very least. Also, why does the Revit point list have sublists? Are they necessary?
Your data is completely different now. External points were in sublists of 4 and now they seem to be a single list. Take the time to slow down and look at your data. Try to understand what the nodes are doing (or supposed to be doing) and make sure your data makes sense. Why are you taking your XY_Coords, Col_Num, and Col_Size lists and sending them to a List.Create node? All that’s doing is adding another list level that goes against what you’re trying to do. The List.Clean nodes are probably fine but could be causing issues if things don’t line up between the three separate lists. They’re probably unnecessary anyways since I would think you wouldn’t be getting any nulls or empties if you’re managing the data correctly. If your data doesn’t look like my example data then you need to make it match (if possible) or change the list levels to work with your data structure.
The nulls will occur coming from External software. Sometimes the columns in our buildings do not all start and stop at same level or even exist on certain levels. The original node i developed to extract the data from external software came from their companies API data access coding. It is very specific on how it reads the data and in turn how it shows up. You can’t really filter out the non existent columns (nulls) per se, until after the data gets extracted and shown in Dynamo. Their data will just tell you that a column doesn’t exist and when translated turns in a null in Dynamo. I will continue tweaking and trying to make it all work. I thank you so much for the help and time, i think i am making strides but we shall see.