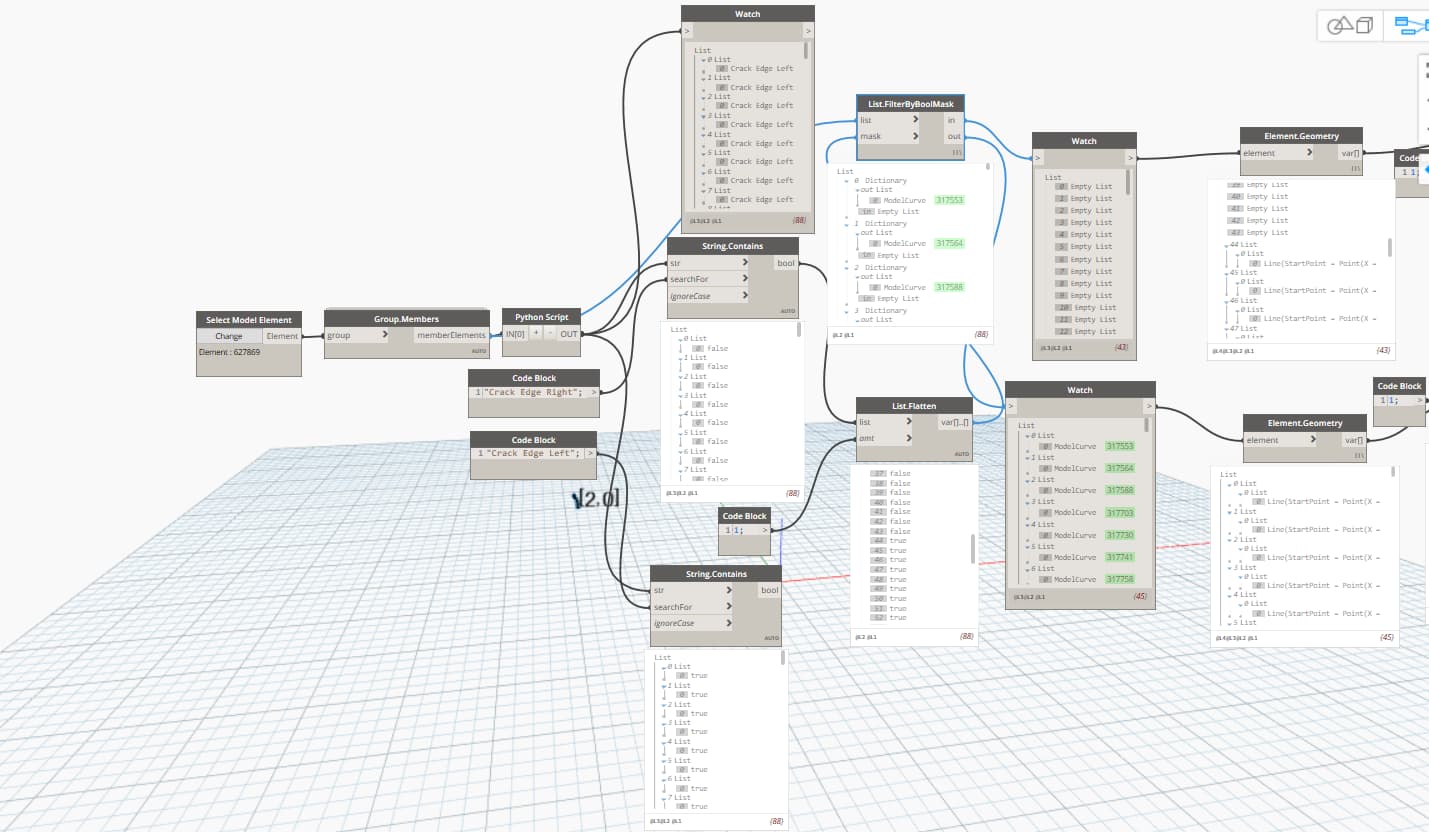
hey guys! i am currently using revit 2021 and i used model lines to create the outlines of an irregular crack shape where i created a new line style named left edge and another named right edge for both sides of the shape and used the standard line style for the 2 horizontal lines connecting the upper and lower ends. now, my goal is to join all the model lines in the right side to form one model line and the to do the same for the left side, so that i can calculate the distance(thickness of shape) between both sides since the shape is irregular and the distances between the lines on both sides isn’t equal nor uniform. since i need the distance/thickness of the shape. the dynamo code is attached below, where the polycurve.byjoined curves didn’t join them despite the lines being connected in the model group . thanks in advance!!


Hey Mike. I tried list flatten node with the amount set to 1,2 and default setting and all gave the same results
You need to show us so we can correct any errors.
You mean by changing the amount of the list flatten node? When set to auto it gave the total number of polycurves(44) and when set to 1 it gave a list of all the polycurves without joining them as shown in the screenshots above
I think what is meant is we need to see the graph, including the data dropdowns, so that we can understand what the structure is in the context of what you’re struggling with.
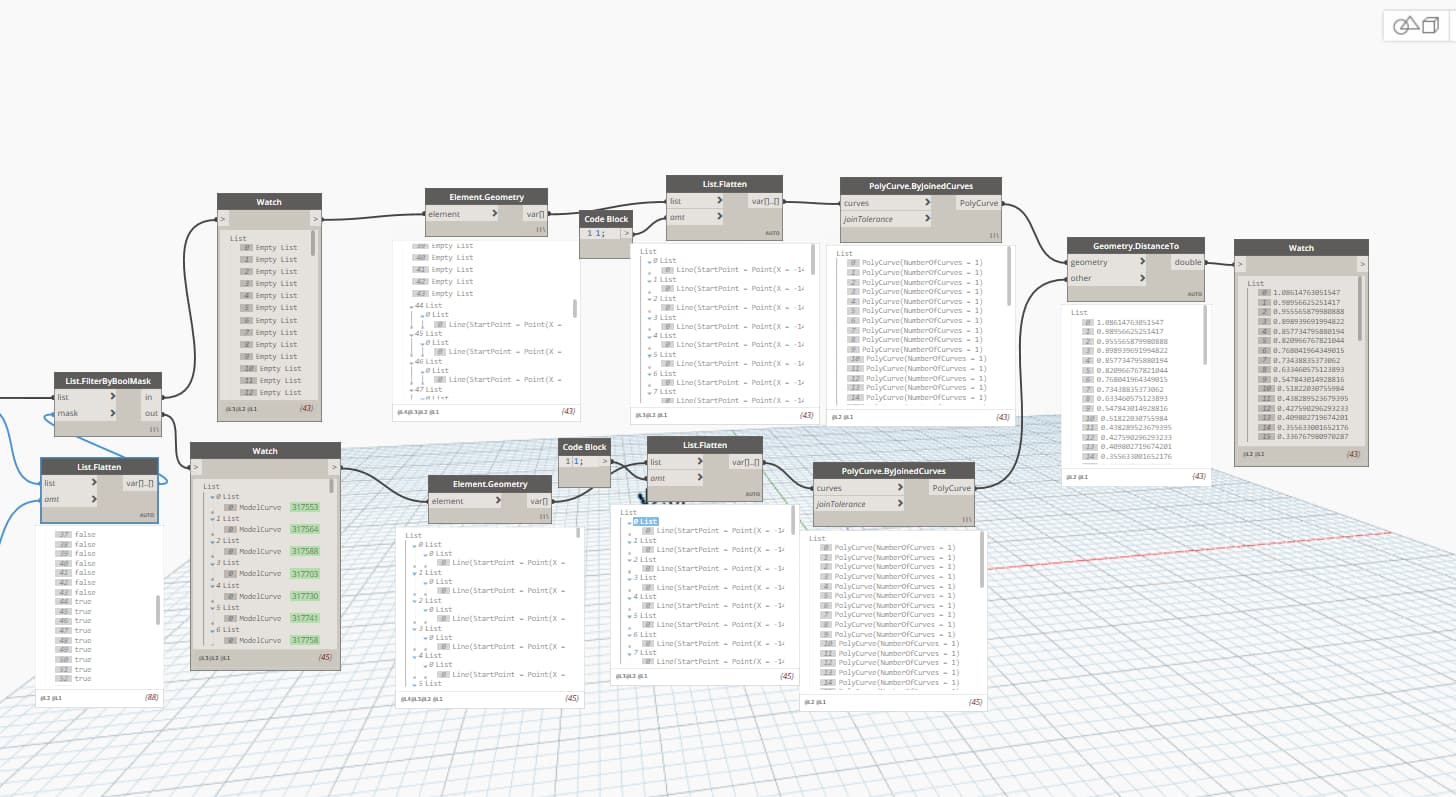

You want to fully flatten the list of lines (no amt input) so that the whole list gets joined. Right now you still have lists of individual lines which means they have nothing to join with.
43 lists → 43 joined polycurves
1 list → 1 joined polycurve
Technically by not providing an input you’re using a value of -1 so you can provide that as well, but skipping the input is likely the best path forward here.
@haya.ehab you’re a few versions behind on the support cycle so you’re going to struggle with automation and have some security concerns if you are on a CPU with network access (which is the case as you can send screenshots). I recommend updating to a supported build (2023 or later) as that will both make this exercise easier (Polycurve.ByGroupedCurves and you’re done; no filtering or even line styles required), and enable more advanced geometrical analysis by way of the CPython3 integration (finding the largest opening the crack becomes VERY easy - horizontal measurements won’t likely work out the way you’d hope).
I did do that and it gave the same output ![]()
So i pretty much need to update both the Revit and accordingly the dynamo plug-in? But my only concern is that i dont lose any data in my BIM/dynamo since i already have other working scripts that i need.
Again, it’s only helpful if you show us so we can comment on the specifics. If you have a fully flatten list and you’re still getting 43 polycurves then something is off. I would expect an error if something was wrong with the lines.
Updating the Revit model is the first thing. The second is building g your Dynamo environment - finding the right package version for the new Dynamo build. After that the old graph will open fine. You may have a few small tweaks to make, but generally things will work fine and actually better once you make the tweaks.