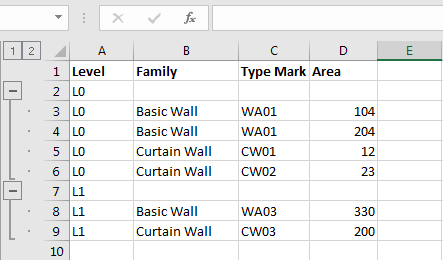

I want to export a table created with dynamo in excel, but having the rows grouped automatically according to the logic of the images. it’s possible to do it?
I want to export a table created with dynamo in excel, but having the rows grouped automatically according to the logic of the images. it’s possible to do it?
Can you creat a sample of your end goal, and what you have tried in Dynamo thus far?
This appears to be possible, but not with any OOTB nodes (or user-created packages either, as far as I am aware). Here is an explanation of how to group rows in an Excel worksheet using the Excel Interop. This would require writing a custom Python node, adding a reference to the Excel Interop. Here is an example I have made previously, largely borrowing from another example in the IronPython Cookbook.
TL;DR: Possible, but requires coding knowledge.
It is probably easier to do the following:
write the ungrouped or unsummarised data into a spreadsheet using Dynamo- this can get overwritten as the data changes
link this data into a separate Excel file or worksheet, and summarise using a pivot table
the grouped data will be embedded in this second file. To update it- just refresh