I am pretty sure there is a simple answer to this- I just can’t figure out what it is…!
I need to take the index of a list and use it as an identifier for a grid of points
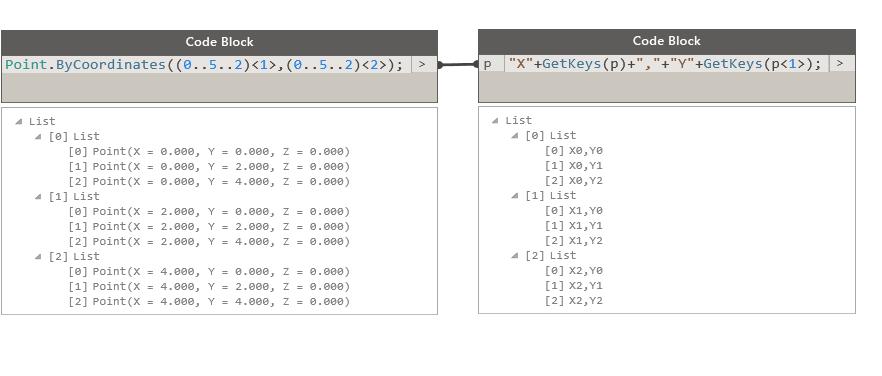
In the example shown below- I need to extract the index of the highlighted point [5,2] and convert it to a string indicating the column/row. So the 5th column & 2nd row --> X5 Y2
I have tried IndexOf, AllIndicesOf etc with no success
thank you in advance
thanks for the very quick reply Dimitar.
I’m not sure if I have explained myself very well- perhaps I mean ‘key’ rather than index.
I would like to generate the XY for each point, not just one of them
At the risk of complicating things- to briefly explain the end goal:
- by feeding a URL to a GIS server, I am extract aerial images of a particular area, defined by coordinates (and some other stuff such as coordinate system, number of pixels, image type etc)
- I am using Dynamo to generate the coordinates for a mosaic of images of a certain size & number of rows & columns
- The output is a file containing the image name, plus the concatenated URL with coordinates etc
For example:
http://maps.six.nsw.gov.au/arcgis/services/public/NSW_Imagery/MapServer/WMSServer?LAYERS=BestImageryDates&FORMAT=image%2Fpng&VERSION=1.1.1&REQUEST=GetMap&STYLES=&SRS=EPSG%3A28356&BBOX=334363.000000,6252655.000000,334463.000000,6252755.000000&WIDTH=800&HEIGHT=800
is part of the Sydney Harbour bridge.
For the image name- I would like it to be ‘X5 Y8.png’ to indicate where it sits in the image array, rather than sequential number such as ‘16.png’
I have attached the graph and output.
thank you
AndrewAerial image extractor.xlsx (11.9 KB)
aerial image extractor.dyn (26.2 KB)
The format of the output can be altered to suit your requirement…
thanks Vikram, that is fantastic- exactly what I needed
Thank you for your help Dimitar
Results below:

2 Likes
[quote=“Andrew_Hannell, post:5, topic:4431”]
exactly what I needed
[/quote]Might you share your final DYN?
Sure
7pm on a Friday here- graph is a bit of a mesh from a rush
Time to go home, but I will tidy it up & share next week…
The graph is quite specific to the Land & Property Dept of New South Wales GIS system,but could be adapted for any WMS server
Andrew
I have attached the tidied up graph and Revit family.
aerial image extractor v5.dyn (61.1 KB)
map grid.rfa (300 KB)
Notes:
- Web Mapping Service (WMS) servers provide data such as aerial imagery, cadastral (boundaries) or land information
- Many authorities, government departments etc provide data using this service
- GIS applications or Map3D or Civil3D can bring in this data dynamically
- Applications such as Sketchup can bring in basic Google aerial imagery, or Infraworks can get data from many sources- but the WMS data is often better quality or contains more information (such as cadastral, survey marks etc
This data is defined in the URL- refer above
I built this Dynamo graph to generate the image URLs based on a base coordinate, grid size and number of rows/columns, and name the image based on the row/column location.
Refer https://youtu.be/XDbJ_JFnK0s
Each WMS server is a bit different- need to play around with the URL layers, file format etc and also enter the correct EPSG coordinate zone.
I used Pentaho to download the images and name them correctly. Tested up to 100x100 rows & columns- takes several hours to generate/download the images.
It is not super-accurate (speak to a surveyor or GIS person & they will talk about geodetic projections etc) but at least you get images with known real world dimensions & corner coordinates, and these can easily be built into a mosaic.
Hope it helps
Andrew
3 Likes