Hello! I’m trying to find elements which are close in proximity to one another and list those elements in a defined structure. For example, if you take the picture below, box 2 has box 1 “upstream” of it and box 3 “downstream” of it. I would like to use the end point and start point proximity of those boxes (shown in pink and green dots) to determine that box 1 is indeed upstream of box 2, and box 3 is downstream of box 2 and list them like shown in the second picture below. The second picture shows what the completed list would look like for the 3 boxes. I can get the elements start point and end point in dynamo, but I’m not sure where to go from there. Thank you for your help
Picture 1:
Picture 2:

Hey Michelle.
Geometry.Distance to can help here, but if you have a polycurve or group of curves along a line then that may be used to generate the pairs faster. Would also help to know if the boxes are designed to touch.
For the former, use a List.RemoveItemAtIndex to remove each item from the list in sequence. Watch the lacing and levels closely. The result should be something like [[B2,B3,B4],[B1,B3,B4],[B1,B2,B4],[B1,B2,B3]];
Then test each item in the original list for distance to the matching sublists in the dropped items list. That is B1 to [2,3,4], B2 to [1,3,4] etc. of the distance is less than your tolerance, get the item.
A polyline parameterization method may be easier as you can sort by distance along the curve by point parameterization, pads with a null on either end of the list, chop into lists of 3, and have lists of [_,1,2],[1,2,3],[2,3,4], etc. without the need to do any complex geometry tests.
1 Like
Thanks Jacob!
To answer your first question, the boxes are designed to have a gap of anywhere from 0 to 200mm between them.
I tried your first suggestion and wasn’t sure how to use the List.RemoveItemAtIndex node the way you were suggesting, so I tried a different route shown below. I can filter out the “gap” values between the boxes which I felt was useful, but I’m not sure where to take it from here to get it into the list you show above. I assume there’s a sort list by keys node I’m needing downstream somewhere, but I don’t have much experience with those. Perhaps I’m already starting incorrectly with my inputs to the Geometry.DistanceTo node? My thought was to compare the end points to the start points and use Shortest lacing, however it just returned the length of the element, so when I used Cross Product, I got a closer result as I could see the values I wanted in the list of 289 items and filtered from there.
Your second suggestion, I’ll admit, I didn’t understand. I can get individual Curves from my elements quite easily with start point, end points (as you can see in the script above), but I’m not sure how to list, sort, and chop them appropriately to get the desired result.
This is getting close to what I was thinking, and may work for you, but seems very heavy handed and inefficient - if there is a way to get what you are after which doesn’t involve this degree of computational complexity you’re usually better off avoiding it. Hard to know what direction to help you go without some more insight into the overall process and workflow - that is how did you get to this point, and where do you want to be after this is done. Can you provide some sample files or a common start point for me to think on? Avoiding the point breakdown could help (that is take the first element via manual selection, remove it from the other list, and then manually chain the objects via polycurve creation and some imperative design script or Python), or it could make things worse. The context will matter here.
Alright, took some time to re-evaluate our goal with the script and specify where we’re getting stuck before replying to you.
Below is a bit of the background and overall goal we’re trying to get to with the script. Perhaps there’s a better way to approach this from the start, and we’re happy to look at other solutions, but we have yet to come up with those ourselves.
Our script is updated and attached. We were able to get a little farther with it so the end list.transpose now returns the components “customer name” parameter, the upstream gap value, and the downstream gap value for every component. Assuming this is the correct path to go with our goal, we now need to change the gap values into the “customer names” of the components those gap values belong to. An example of what the completed script would look like is below (first pic). Of course if there’s a way to change the list structure so the component those upstream and downstream components belong to is at the top of the list structure, that would be preferred (second pic below). We are trying to return the upstream and downstream components of adjacent components.
Option 1:
Option 2: (changed list structure)
Sorry if I’m not explaining myself well. It’s a complex problem to describe the ins and outs of over text.
Let me know if this is what you were looking for.
Thanks! Michelle
1 Like
This is perfect… I’ll review and let you know what I come up with. 
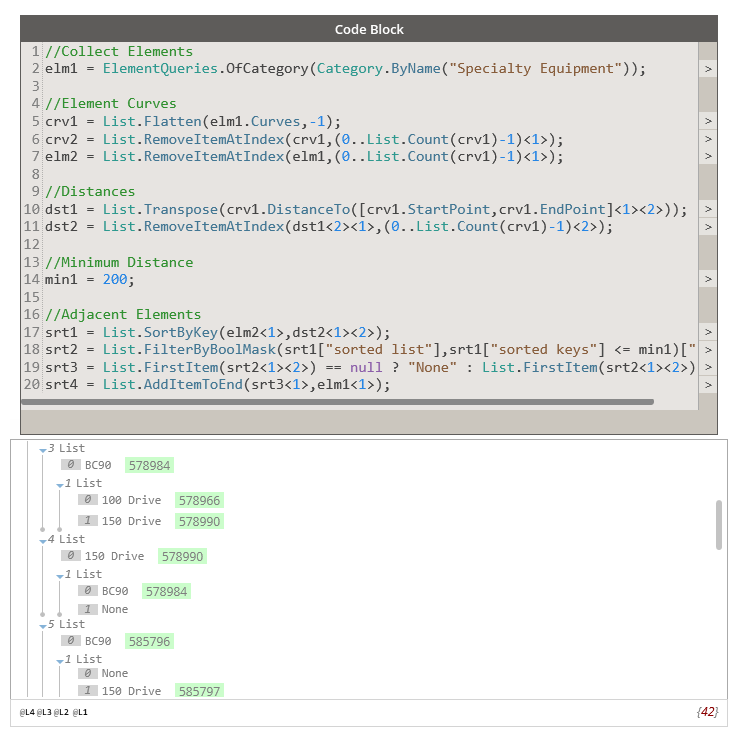
See if this does the needful
The results below are obtained with your sample Revit file.
//Collect Elements
elm1 = ElementQueries.OfCategory(Category.ByName("Specialty Equipment"));

//Element Curves
crv1 = List.Flatten(elm1.Curves,-1);
crv2 = List.RemoveItemAtIndex(crv1,(0..List.Count(crv1)-1)<1>);
elm2 = List.RemoveItemAtIndex(elm1,(0..List.Count(crv1)-1)<1>);

//Distances
dst1 = List.Transpose(crv1.DistanceTo([crv1.StartPoint,crv1.EndPoint]<1><2>));
dst2 = List.RemoveItemAtIndex(dst1<2><1>,(0..List.Count(crv1)-1)<2>);

//Minimum Distance
min1 = 200;

//Adjacent Elements
srt1 = List.SortByKey(elm2<1>,dst2<1><2>);
srt2 = List.FilterByBoolMask(srt1["sorted list"],srt1["sorted keys"] <= min1)["in"];
srt3 = List.FirstItem(srt2<1><2>) == null ? "None" : List.FirstItem(srt2<1><2>);
srt4 = List.AddItemToEnd(srt3<1>,elm1<1>);
1 Like
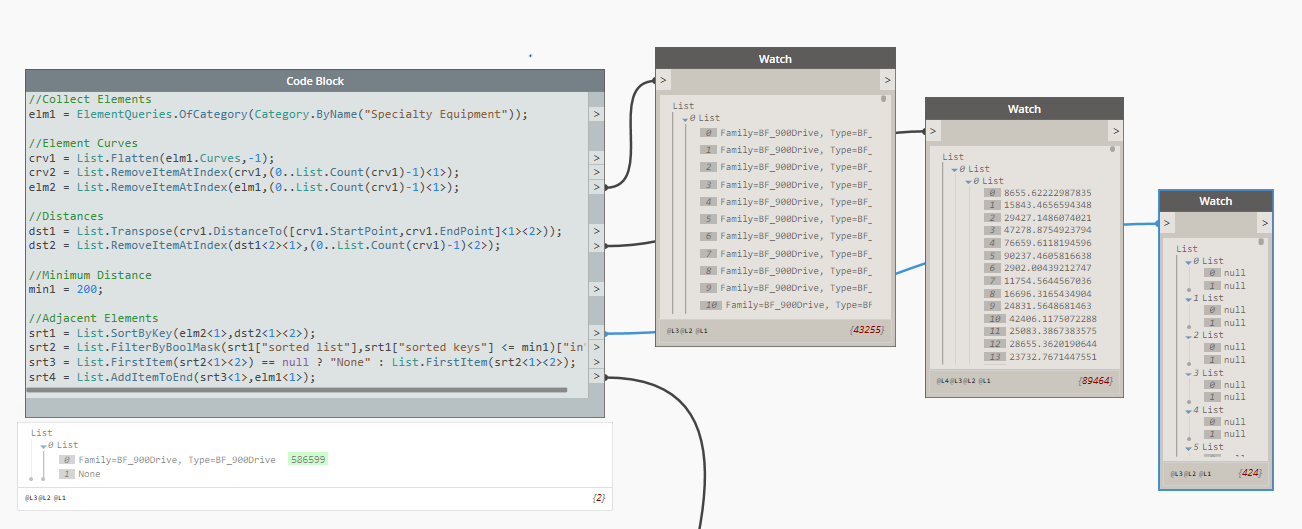
Vikram, thank you very much! This worked perfectly (seriously, PERFECTLY!) on our small model (similar to the one I posted in here), but it didn’t seem to like our larger model. Below is the values that return from the code block on our larger model. The larger model contains basically the same families in it and some additional ones, but all of the Specialty Equipment category.
I think it has something to do with the items returning from the dst2 not matching the items returning from elm2, but I really don’t know what’s wrong. The first encounter with the null values happens at the srt1 list. Any ideas?
Thank you!
1 Like
Unable to spot the probable cause of the issue 
Could you confirm that List.Count of elm1 and crv1 is the same?
ah, I can confirm that it is not the same! Additionally I think I narrowed down the issue in that though all of our families are categorized as Specialty Equipment, there are Adaptive Point families in here too and as soon as I add an adaptive family to the original smaller model, I get the same results the larger model threw at me. Could that be the issue?
This can only work if there is only one pair of start and end points for each element.
Since we are extracting the start and end points from the element curves, it means that each element should have only one element curve.Won’t work otherwise.
To make it work with different families which don’t have just one element curve would need to think of another approach to obtain start and end point pairs for each element.
Alternately, if possible, you could consider rebuilding the offending family to have only one element curve, similar to the others.
This is great. I’ve narrowed down the issue to a few “offending” families that I think I can fix. Thank you for your help
On a side note, in our development team, when people do things well, they earn tacos. You my friend, have definitely earned tacos! Thank you very much! I will mark your earlier code as the solution.
2 Likes