I want to create filled regions based upon the panels in a curtain wall.
I find a difficult because no curves are returned, neither is familyinstance.location.
The curtainwall panel instance is a panelfamily as window, with a shared window family inside.
So before I’m even at the point of creating a filled region, I need some location / curves to begin with.
I thought to get the boundingbox of the panels hosted on a curtain wall, this gives me a minpoint and maxpoint , if this is the best way: how to convert that to a curve (assuming I need a curve to create a filled region)
What am I missing?
Btw: I want the location point too! (origin location)
I would but I’m stuck at an airport with only acell phone for internet access. May be on a flight in about two hours. May not be on a flight until Tuesday, all because British air can’t get their planes out of JFK.
For location: Curtain panels themselves don’t have locations in a true sense. They fill the void between grids. I have used other elements nested into the panels to find the panel locations before (nested shared families) but this proved difficult to control and unreliable. You could try finding the midpoint of the line across the bounding box. Best to do this as inline code in a code block to reduce memory usage.
May be better off projecting the surfaces of the curtain panels onto the view plane to ensure off axis panels have the view plane aligned correctly.
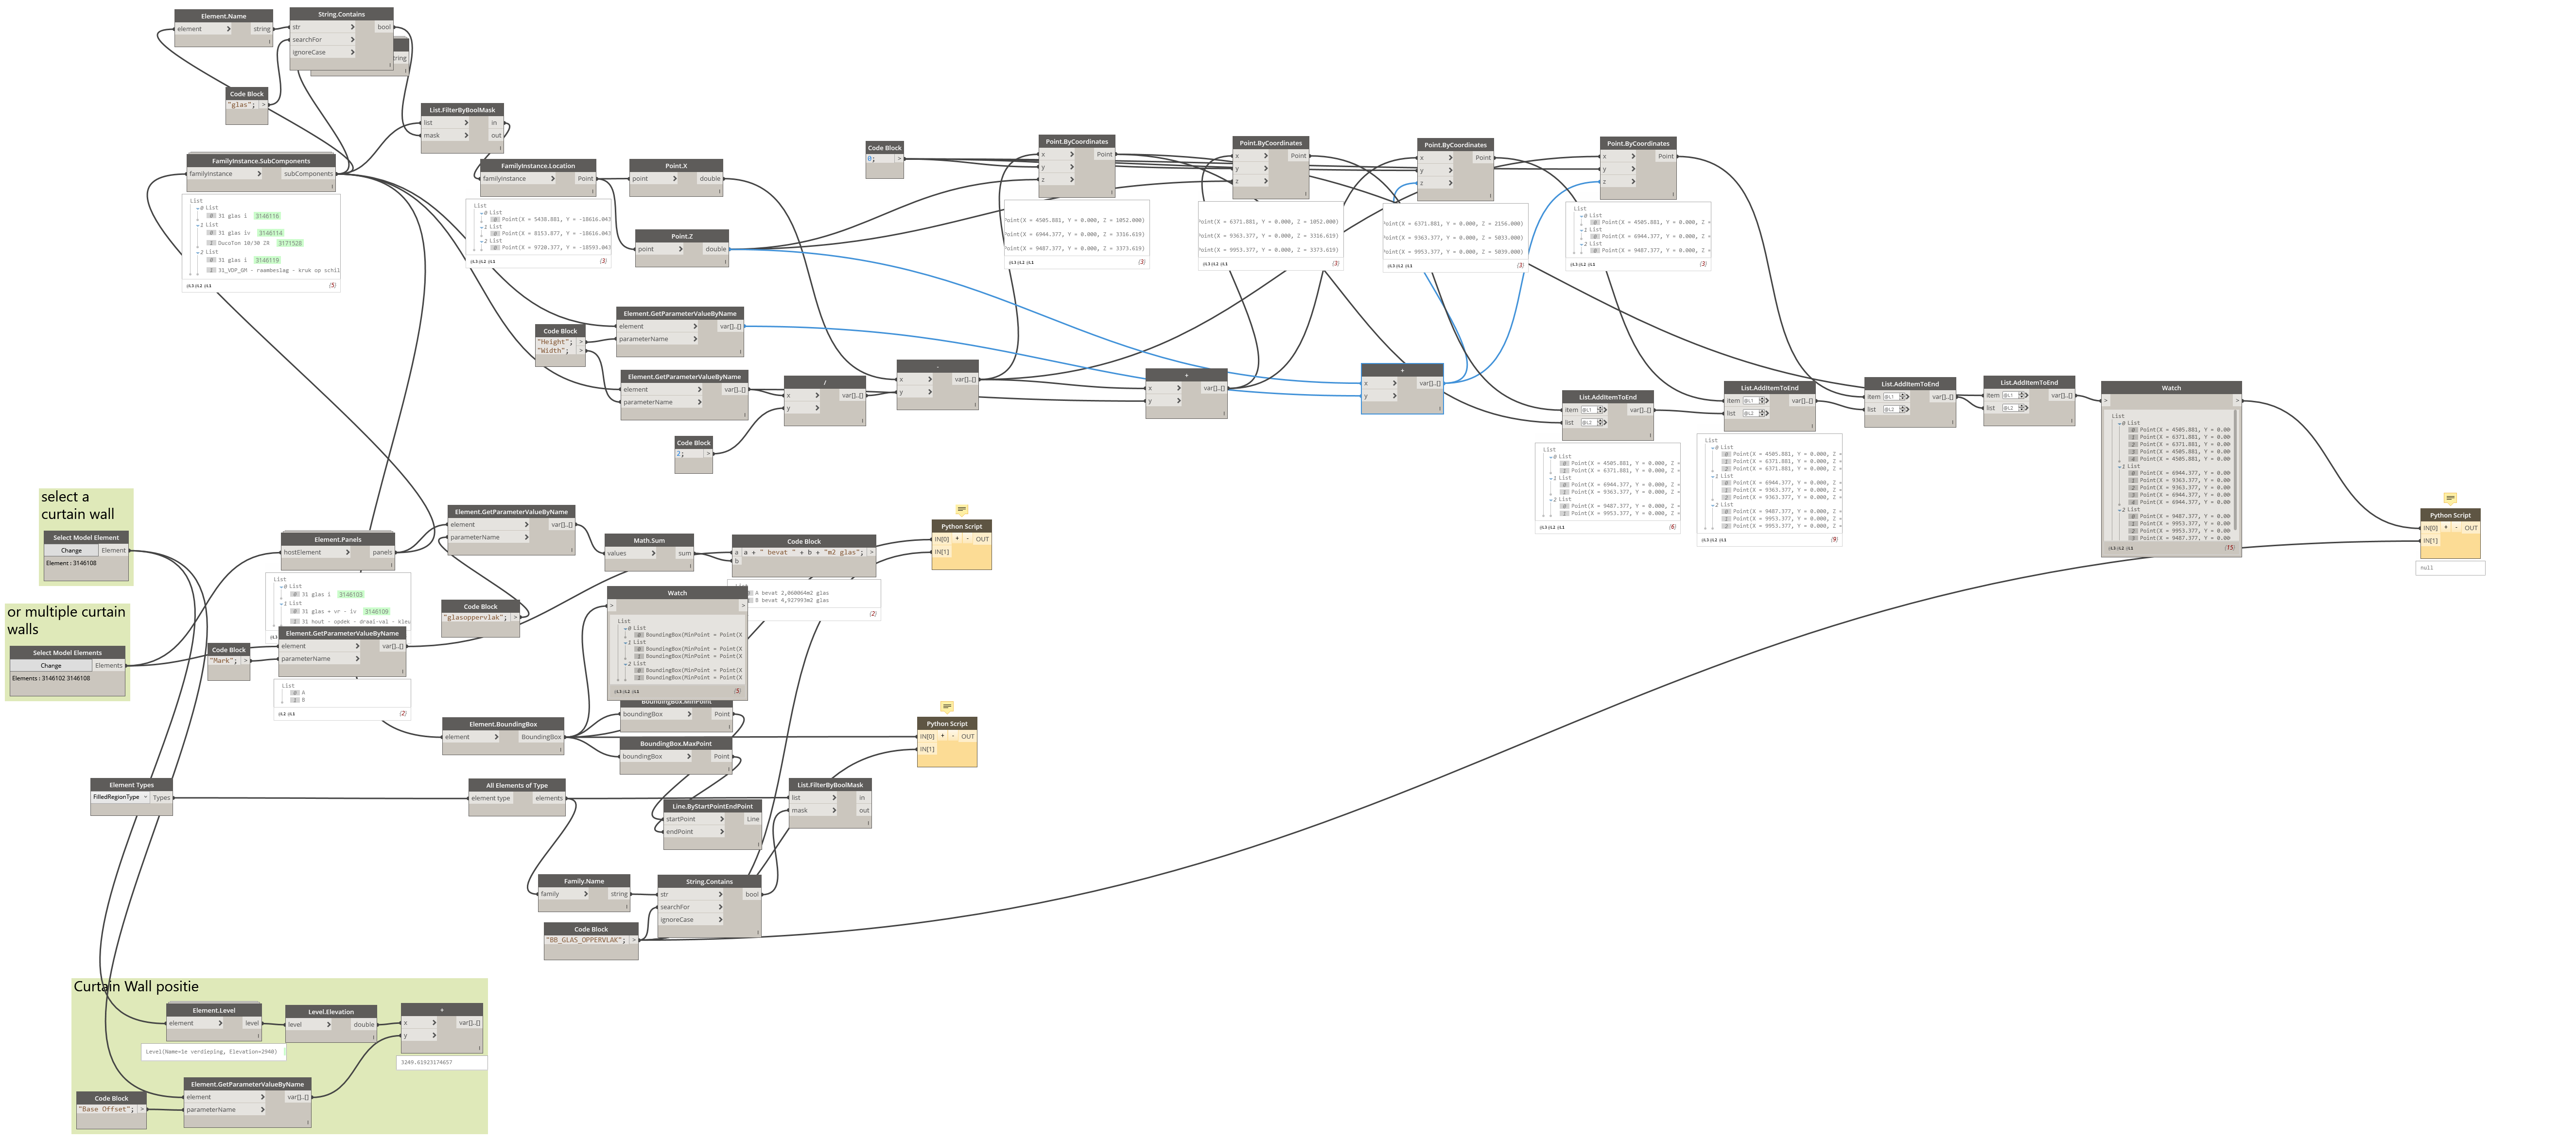
I have a list of points from the panels, including a 5th to close the loop (for the region)
Next is the python script to turn those into a region. Since they are points and not XYZ, they are converted but still … no magic.
Anybody: what am I doing wrong?
import clr
clr.AddReference('ProtoGeometry')
from Autodesk.DesignScript.Geometry import *

# Import Nods
clr.AddReference("RevitNodes")
import Revit
clr.ImportExtensions(Revit.Elements)
clr.ImportExtensions(Revit.GeometryConversion)

# Import DocumentManager and TransactionManager
clr.AddReference("RevitServices")
import RevitServices
from RevitServices.Persistence import DocumentManager
from RevitServices.Transactions import TransactionManager

# Import RevitAPI
clr.AddReference("RevitAPI")
import Autodesk
from Autodesk.Revit.DB import *

doc = DocumentManager.Instance.CurrentDBDocument
uiapp = DocumentManager.Instance.CurrentUIApplication
app = uiapp.Application

regions = []
activeViewID = doc.ActiveView.Id;

TransactionManager.Instance.EnsureInTransaction(doc)

filledRegionName = IN[1]

for fr in FilteredElementCollector(doc).OfClass(FilledRegionType):
    if Element.Name.GetValue(fr) == filledRegionName:
        frt = fr
        break


for bound in IN[0]:
	test = []
	profileLoops = []
	profileLoop = CurveLoop()
	#create filled regions
	#bound has 4 points + 5th which close the loop

	for i in bound:
		test2 = i.ToXyz()
		test.append(test2)

	f = 0
	for e in test:
		#e gives XYZ points, needed to create a bound ?
		profileLoop.Append(Autodesk.Revit.DB.Line.CreateBound(e[f],e[f+1]))
		f += 1

	profileLoops.Add(profileLoop)
	region = FilledRegion.Create(doc,frt.Id,activeViewId,profileLoops)
	regions.Add(region)

# End transaction
TransactionManager.Instance.TransactionTaskDone()

#Assign your output to the OUT variable
OUT = regions