I am doing a series of presentations for the local ACE Mentor program (https://www.acementor.org/) on more tech based careers in AEC and after going through the first one last night I thought some Dynamo examples would be good as a demonstration. The groups are at the local high schools (+/-13 - 18 y/o) and include people interested in Architecture, Engineering, and Construction related fields.
However - I don’t use Dynamo that much day-to-day (i.e. I am not good at it), and almost all of the graphs I have are for boring (?) tasks like creating sheets. So I thought I’d ask here if anyone has any interesting graphs they would be willing to share as a quick demo - something in the 30 second runtime range (my laptop is not a workstation.) Or if you know of good examples that area available. I will of course credit
I remember when it was new and there were a lot of things like using an image to create/modify curtain wall, and wonky forms - and of course all I could think of sitting in those sessions was can I use it for boring things like creating sheets
Or if anyone wants to contribute to the presentations that is appreciated also.
So - thank you in advance, and if you want to share something but can’t post publicly feel free to send me a message/email.
-chad
edit: I did just see the Holiday Contest thread - I’ll poke through that as well.
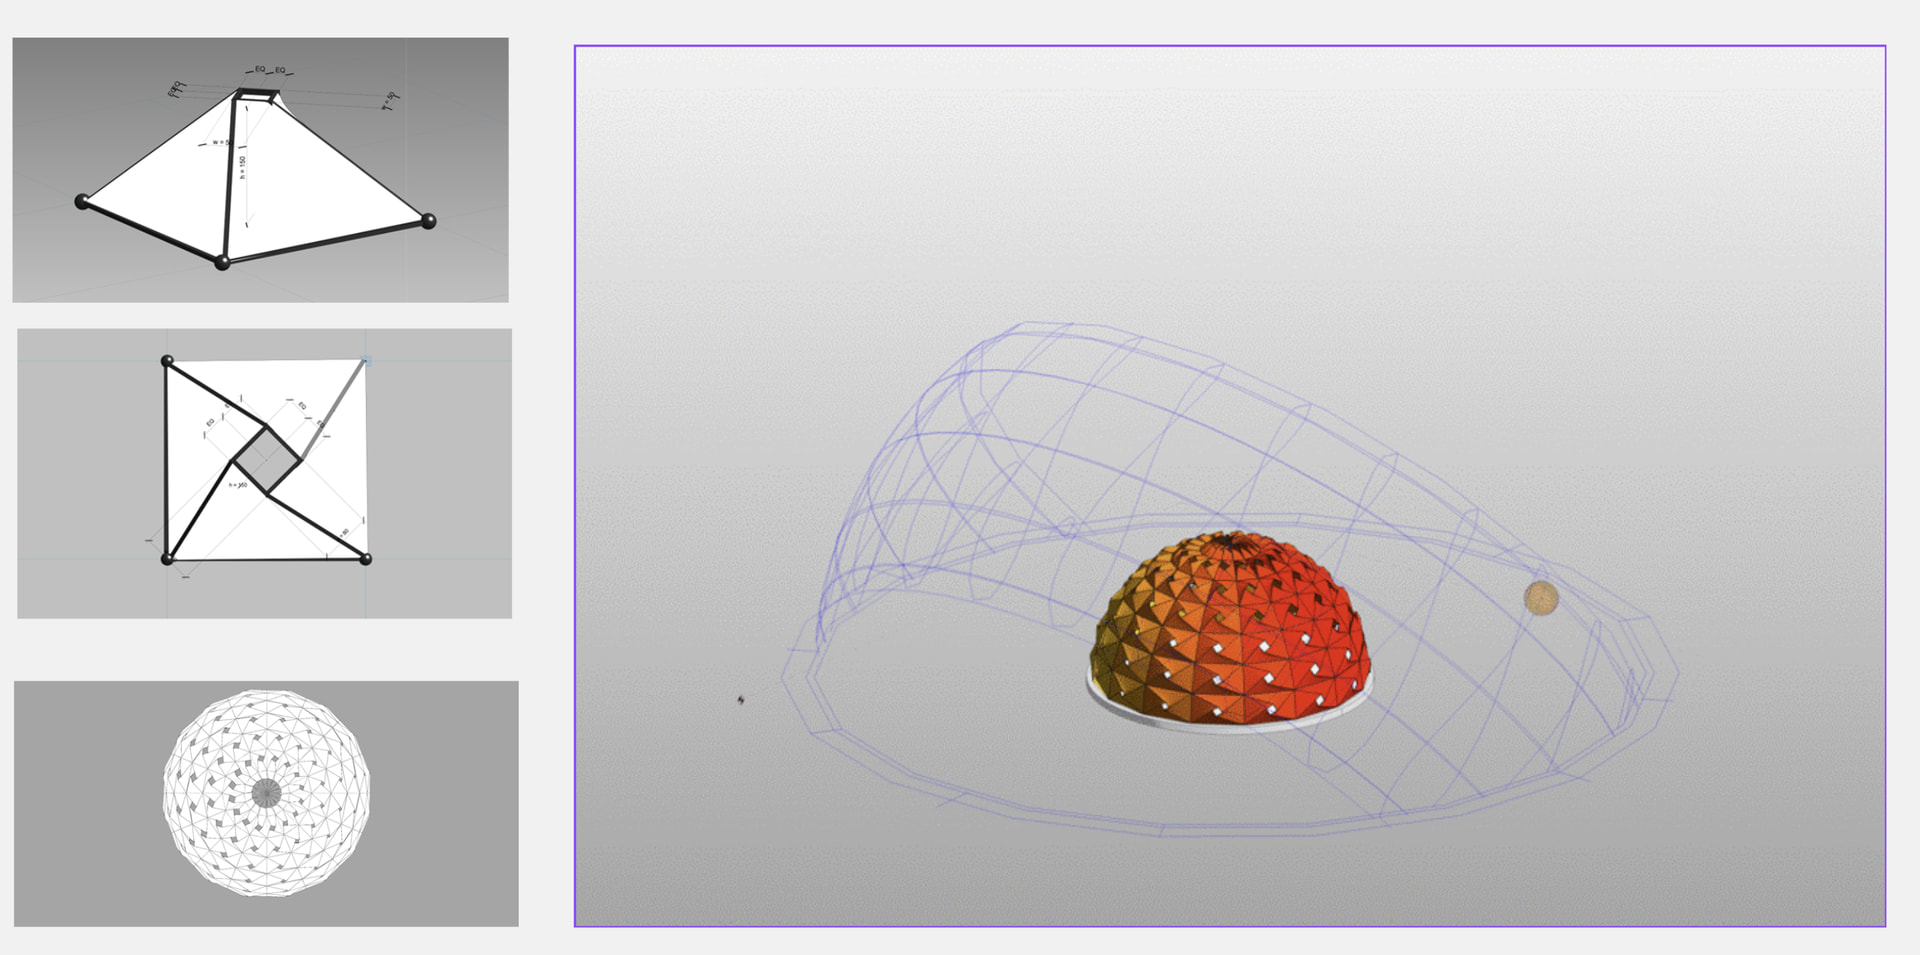
Here, there is a kinetic panel exercise where panels react to the sun’s position. The link is valid for 3 days. I have panels for the top part of the dome separately. You can manually change them to the top panel family for a better look. If it is not in the perfect shape, feel free to contact me privately. We can make a Zoom call to make it run, properly
Feel free to use them however you like. I have a backlog item to add more from over the years. I have all sorts of screenshots of me playing around in Dynamo on Twitter that need the DYNs saved somewhere.
There are some images of the graphs, like this one:
Brief paraphrased summary of ACE: It is a program for high school students that are interested in AEC careers. The mentors are people in the local AEC community (architects, engineers, contractors, etc) that come in and run the program. There is also a design charrette that they participate in.
I did my first session this past Monday, and the next one is Jan 28. They are roughly every 2 weeks over the course of the semester- each at a different school. I’m making adjustments to the presentation as I go, so no real hard deadline. I should have enough at the moment to cover me through the next presentation, but will happily take more - gotta keep them entertained
See this as written permission to share/modify/take ideas from my channel scripts.
Nowhere near as curated as better gits but if it helps, all yours:
Love to see this type of education and sharing. Hope it goes well! No doubt some of the fun examples on Jon’s git will go down well - humor = memorable in my xp.
One technique i use in selling the value of dynamo is by showing a basic concept e.g. setting parameter values, then gradually scale it up to the point where its less about showing a graph and more about showing the possibilities. E.g. eventually the concept scales to n parameters by n values via excel and back. I find typically it works well as you pique the interest of people completely new but also ideally surpass those with some xp to avoid dismissal of the value of visual coding.
Totally get the challenge of making something unsexy look fun for people in high school. Visual examples with geometry likely help them relate, or tieing it to a professional story to help them aspire to success in the field if theyre interested on it and how they might be someone in it. Worth reminding them of the roadmap of this type of tech, inevitable AI intrusions into the space and the fact when they graduate it’ll be this +7 years of development (so just imagine how great it will be then!).