Just want to know this. I am trying to use dynamo plot two series of data , and conduct several statical functions and show the results using a diagram. Is it possible I can write a python script (or something like that) to import matplotlib in this case?
Thanks
I don’t think this is possible. You’re probably better off using Dynamo to extract your data in a standard file format such as a CSV file and then processing it externally with matplotlib.
According to their documentation: https://matplotlib.org/users/installing.html it has dependencies on things like python 3.6 or greater and numpy so i don’t think you can use that in Dynamo. Dynamo is actually built on top of something called IronPython which is a .NET wrapper around python 2.7. I don’t think Dynamo fulfills matplotlib’s requirements.
Now (Revit 2022) Dynamo use python 3. is it possible now to use Matplotlib?
Yes you can use it, except the plt.show() method
example of workaround here

Try reducing the periodic interval. The gif from that thread is likely sped up given interval is 1000ms.
Thank you but nothing changed.
here is the code for an animated version
import sys
import clr
import System
clr.AddReference('ProtoGeometry')
from Autodesk.DesignScript.Geometry import *
clr.AddReference('Python.Included')
import Python.Included as pyInc
path_py3_lib = pyInc.Installer.EmbeddedPythonHome
sys.path.append(path_py3_lib + r'\Lib\site-packages')

clr.AddReference('System.Drawing')
import System.Drawing
from System.Drawing import *
from System.Drawing.Imaging import *
from System.IO import MemoryStream

import numpy as np
import matplotlib.pyplot as plt
from PIL import Image
import io

def plt2arr(fig, draw=True):
    """
    need to draw if figure is not drawn yet
    """
    if draw:
        fig.canvas.draw()
    rgba_buf = fig.canvas.buffer_rgba()
    (w,h) = fig.canvas.get_width_height()
    rgba_arr = np.frombuffer(rgba_buf, dtype=np.uint8).reshape((h,w,4))
    return rgba_arr

def convertToBitmap2(bytes):
    out = None
    with MemoryStream(bytes) as ms:
        out = Bitmap(ms)
    return out


sec = IN[0].Second + 1 # input node Datetime Now
#print(s)
# plot sin and cos wave
fig = plt.figure()
ax = fig.add_subplot(111)
x = np.linspace(-np.pi, np.pi)

ax.set_xlim(-np.pi, np.pi)

ax.set_xlabel("x")
ax.set_ylabel("y")
#ax.plot(x, np.sin(x), label="sin")
ax.plot(x,  np.sin(x - 0.2 * sec), label="sin")
#ax.plot(x, np.cos(x), label="cos")
ax.plot(x, np.cos(x - 0.2 * sec), label="cos")
ax.legend()
ax.set_title("sin(x) and cos(x)")
fig.canvas.draw()

image_from_plot = plt2arr(fig)
# remove alpha
image_from_plot = image_from_plot[:, :, :-1]
# convert to PIL Image
image = Image.fromarray(image_from_plot, "RGB")
# convert to Python ByteArray
byteIO = io.BytesIO()
image.save(byteIO, format='BMP')
byteArr = byteIO.getvalue()
# convert to Net ByteArray
netBytes = System.Array[System.Byte](byteArr)
bitmap = convertToBitmap2(netBytes)

OUT = bitmap

Thank you
import sys
import clr
import System
clr.AddReference('ProtoGeometry')
from Autodesk.DesignScript.Geometry import *
dirAppLoc = System.Environment.GetFolderPath(System.Environment.SpecialFolder.LocalApplicationData)
sys.path.append(dirAppLoc + r'\python-3.8.3-embed-amd64\Lib\site-packages')
clr.AddReference('System.Drawing')
import System.Drawing
from System.Drawing import *
from System.Drawing.Imaging import *
from System.IO import MemoryStream
import numpy as np
import matplotlib.pyplot as plt
from PIL import Image
import io
import math
def plt2arr(fig):
"""
need to draw if figure is not drawn yet
"""
fig.canvas.draw()
rgba_buf = fig.canvas.buffer_rgba()
(w,h) = fig.canvas.get_width_height()
rgba_arr = np.frombuffer(rgba_buf, dtype=np.uint8).reshape((h,w,4))
return rgba_arr
def convertToBitmap2(npImgArray):
bitmap_ = None
# remove alpha
if npImgArray.ndim == 3 and npImgArray.shape[-1] == 4:
npImgArray = npImgArray[:, :, :-1]
# convert to PIL Image
if npImgArray.ndim == 3:
image = Image.fromarray(npImgArray, "RGB")
else:
image = Image.fromarray(npImgArray, "L")
# convert to Python ByteArray
byteIO = io.BytesIO()
image.save(byteIO, format='BMP')
byteArr = byteIO.getvalue()
# convert to Net ByteArray
netBytes = System.Array[System.Byte](byteArr)
with MemoryStream(netBytes) as ms:
bitmap_ = Bitmap(ms)
return bitmap_
#///////////////////////////////////////////////////////
def koch_snowflake(order, scale=10):
"""
Return two lists x, y of point coordinates of the Koch snowflake.
Parameters
----------
order : int
The recursion depth.
scale : float
The extent of the snowflake (edge length of the base triangle).
"""
def _koch_snowflake_complex(order):
if order == 0:
# initial triangle
angles = np.array([0, 120, 240]) + 90
return scale / np.sqrt(3) * np.exp(np.deg2rad(angles) * 1j)
else:
ZR = 0.5 - 0.5j * np.sqrt(3) / 3
p1 = _koch_snowflake_complex(order - 1) # start points
p2 = np.roll(p1, shift=-1) # end points
dp = p2 - p1 # connection vectors
new_points = np.empty(len(p1) * 4, dtype=np.complex128)
new_points[::4] = p1
new_points[1::4] = p1 + dp / 3
new_points[2::4] = p1 + dp * ZR
new_points[3::4] = p1 + dp / 3 * 2
return new_points
points = _koch_snowflake_complex(order)
x, y = points.real, points.imag
return x, y
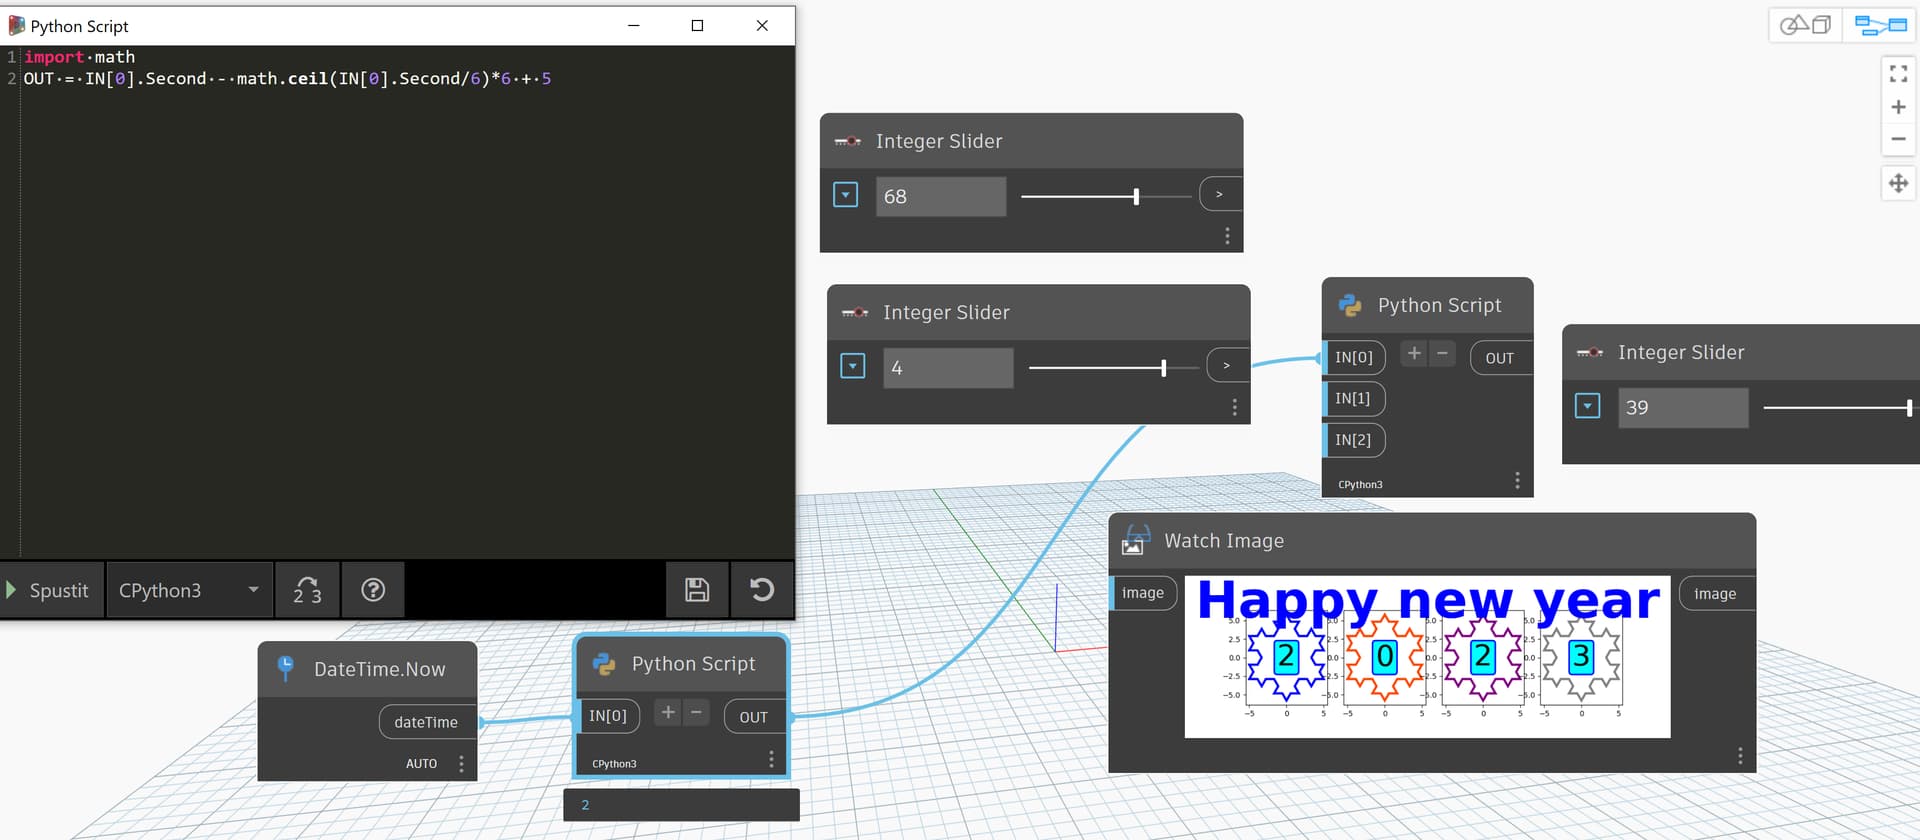
x, y = koch_snowflake(order=IN[0])
fig, (ax1, ax2, ax3, ax4 ) = plt.subplots(1, 4, figsize=(9,3),
subplot_kw={'aspect': 'equal'})
ax1.fill(x, y, facecolor='none', edgecolor='blue', linewidth=3)
ax2.fill(x, y, facecolor='none', edgecolor='orangered', linewidth=3)
ax3.fill(x, y, facecolor='none', edgecolor='purple', linewidth=3)
ax4.fill(x, y, facecolor='none', edgecolor='gray', linewidth=3)
fig.suptitle('Happy new year', fontsize=IN[2], fontweight='bold', color='blue')
s = IN[1]
t1 = ax1.text(
0, 0, "2", ha="center", va="center", rotation=0, size=s,
bbox=dict(boxstyle="round,pad=0.1", fc="cyan", ec="b", lw=2))
t2 = ax2.text(
0, 0, "0", ha="center", va="center", rotation=0, size=s,
bbox=dict(boxstyle="round,pad=0.1", fc="cyan", ec="b", lw=2))
t3 = ax3.text(
0, 0, "2", ha="center", va="center", rotation=0, size=s,
bbox=dict(boxstyle="round,pad=0.1", fc="cyan", ec="b", lw=2))
t4 = ax4.text(
0, 0, "3", ha="center", va="center", rotation=0, size=s,
bbox=dict(boxstyle="round,pad=0.1", fc="cyan", ec="b", lw=2))
image_from_plot = plt2arr(fig)
bitmap1 = convertToBitmap2(image_from_plot)
OUT = bitmap1