While this is in Civil 3D, the problem is strictly list/logic/math related.
I have a group of numbers (structure stations) that I want to check if they are within any (or none) of a group of non-overlapping mathematical ranges (not Dynamo Ranges). Structure station numbers are top left, and the ranges that I want to test them against are bottom left; all the @L1 indices of 0 are the starts of each range, and indices of 1 are the ends of each range.
The big difficulty is isolating each range; if a number falls within one particular range, it obviously won’t fall within any of the other ranges. So simply using “>” or “<“ operators doesn’t appear to be sufficient, because it doesn’t differentiate between each individual range. I have a feeling it might just be finding the right lacing options, but frankly I’m just getting bewildered and lost at this point.
If anyone has any experience with something like this, I’d be grateful to hear your thoughts.
Going to simplify your dataset to start with here (ain’t no body got time to type out all those decimals)…
Say your numbers are [3, 7, 12, 18, 30] and your ranges are [ [0,2], [5,9], [13,16], [20,25] ].
Doing the review manually:
3 is one more than 2 so it should be true.
7 is not within 1 unit of either 5 or 9, but it falls in between, so it should be true.
12 is one less than 13 so it should be true.
18 is 2 less than 20 so it should be false.
30 is more than 2 above 25 so it should be false.
Asking this way as the ‘if a value is in the range already’ wasn’t clear in how you asked it.
If that is correct, then subtract 1 from the first number of the range, and add one to the last number of the range - basically your ranges expand by 1 down and 1 up. Then check if the value is >= the lower limit of the range and <= the upper limit of the range; if so return true; otherwise false.
I’m confused; 3 is greater than 2, and less than 5, so it falls outside of any of the ranges, so shouldn’t it be false? Likewise with 12, it is not within any of the given ranges (greater than 9, less than 13).
Also I’m not quite sure what the significance is of being within 1 unit (or any integer) away from the range numbers. I’m concerned strictly with mathematical “double” or “float” ranges.
I read “within one” as “in the range or one unit below or one unit above” the range. Hence the clarification.
I see the other value as ‘contained in’ not ‘within one’, and in which case your description makes sense.
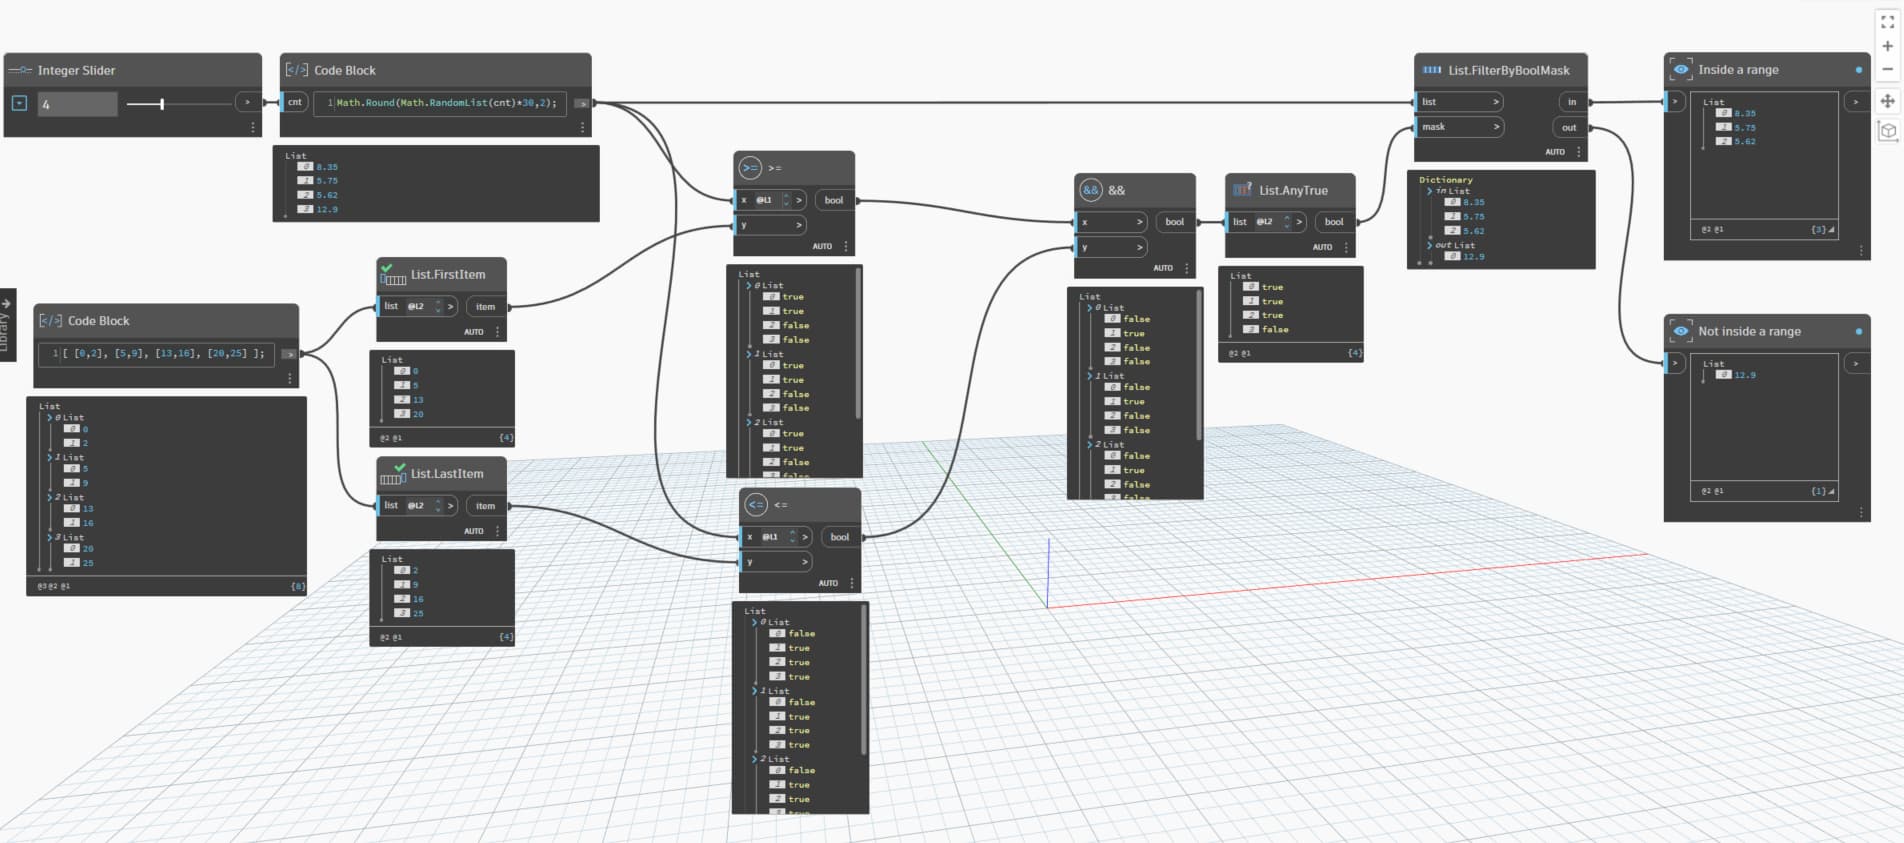
If you just want to find out if the value is contained in any of the ranges, you you test if the value is >= the lower value and <= the upper value. If both of those are true for a given value.
So it’s a >= node, a <= node, and an && node. No need for the addition and subtraction.
This is very close; I came up with something similar (though not as neat and clean), but the problem that has been befuddling me is that I need to track which specific individual range that each station number belongs to.
So this tells me which numbers are in any of the given ranges, but I really need it to also keep track of which range that each number is falling within.
I have a nagging feeling that it may have to involve some kind of loop, or If/Then kind of logical flow…? So, say that you have a number, and 3 different ranges, you might have to test it against each range: is it greater than the first Range Start? If so, then is it greater than the next Range Start? Etc… And the same with the End Ranges. Requiring you to narrow down the range where it is located, in a manner of speaking.
And control flow is one of my biggest weaknesses in Dynamo…
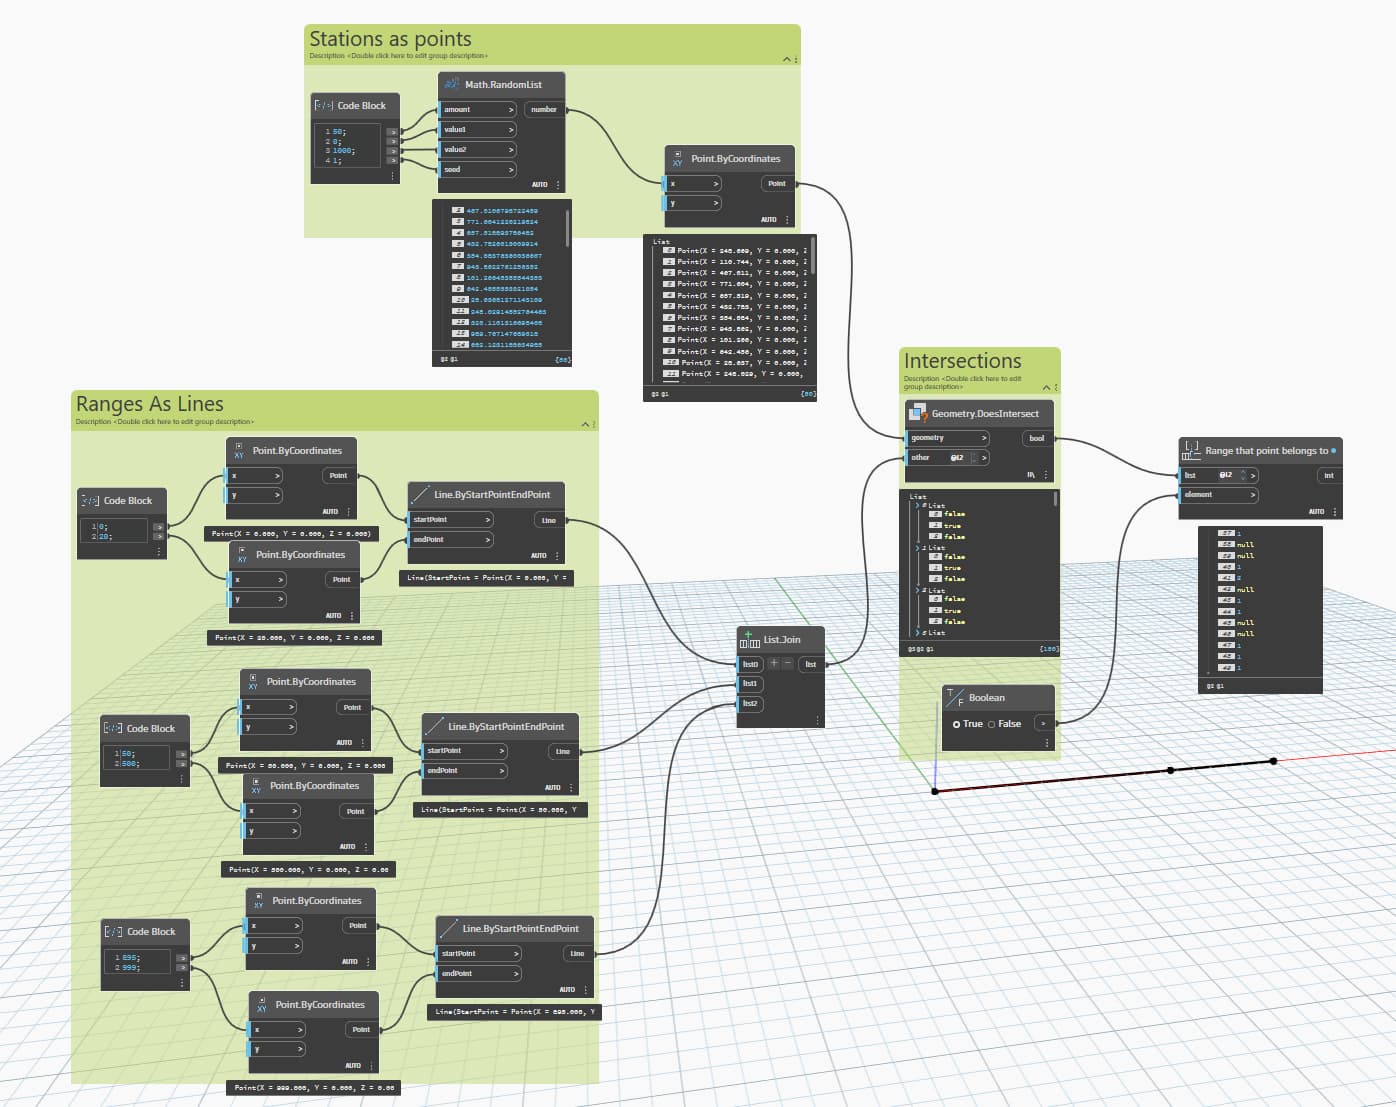
To build on what Jacob offered you, you should be able to do something like this to get both the stations to being checked and their corresponding station ranges. Depending on what you are doing down stream you might need to flatten the lists. There might be more eloquent way to do it, which I would be open to as well.
Changing the list lacing and levels of the <= and the >= nodes should give you the identified structure you are after.
Take it slow, provide one number and a list of ranges. Then two numbers and the same list of ranges. Then test it with a list of numbers and ranges where you can quickly identify the result. Lastly test your real dataset.
This is really cool. The only thing I’ll have to consider is that the number of ranges will vary case to case. I think I can make that work with a little clever point input variations.
not really- it’s sometime easier to learn something new rather than struggle with what you know.
My Python skills are officially “next to useless” and this took 5 mins