Hello everyone,
It’s time to upgrade the Shapely package to the latest version -Version 1.1.3-.
The “Shapely geometry” package not only allows users to manipulate 2D geometries but also integrates seamlessly with ML. In other words, the “Shapely” package comes equipped with ML capabilities, making it more functional and significantly expanding its processing capacity.
But how does Shapely do that with ML?
In order to work with ML, you do need Numpy. Unfortunately, you cannot directly use Dynamo geometries within an ML model. This is where « Shapely geometry » comes into play. It allows you to perform these operations directly using Numpy, making it a valuable tool for integrating geometry operations into your ML workflows.

Meaning, we need to first convert any 2D geometry into « Shapely geometry » and then into ‘Numpy’ data. Don’t worry, we don’t lose any data during all these conversions. In summary, we are transforming the geometry into another format without losing any data. This is truly a very functional and flexible data interchange.
So what awaits us after making our data ready for the model?
To utilize machine learning models, there are two different approaches:
1- Enabling predictions with a pre-trained model using a dataset (Fast, simple, and sustainable) -
2- I’m talking about creating the dataset within your scenario, which means training the ML model within the scenario (Slow, laborious, and one-time use).
Today we will choose the fast way in this package and to use Machine Learning Models in our scenarios we will need a dataset, i.e. we will need a “.CSV” file. - For traning an empty .csv file is enough for us.- Here is an example: We can make the dataset using the data from our model. For this we need to convert “Dynamo geometry” to “Shapely geometry” and then to “Numpy”.

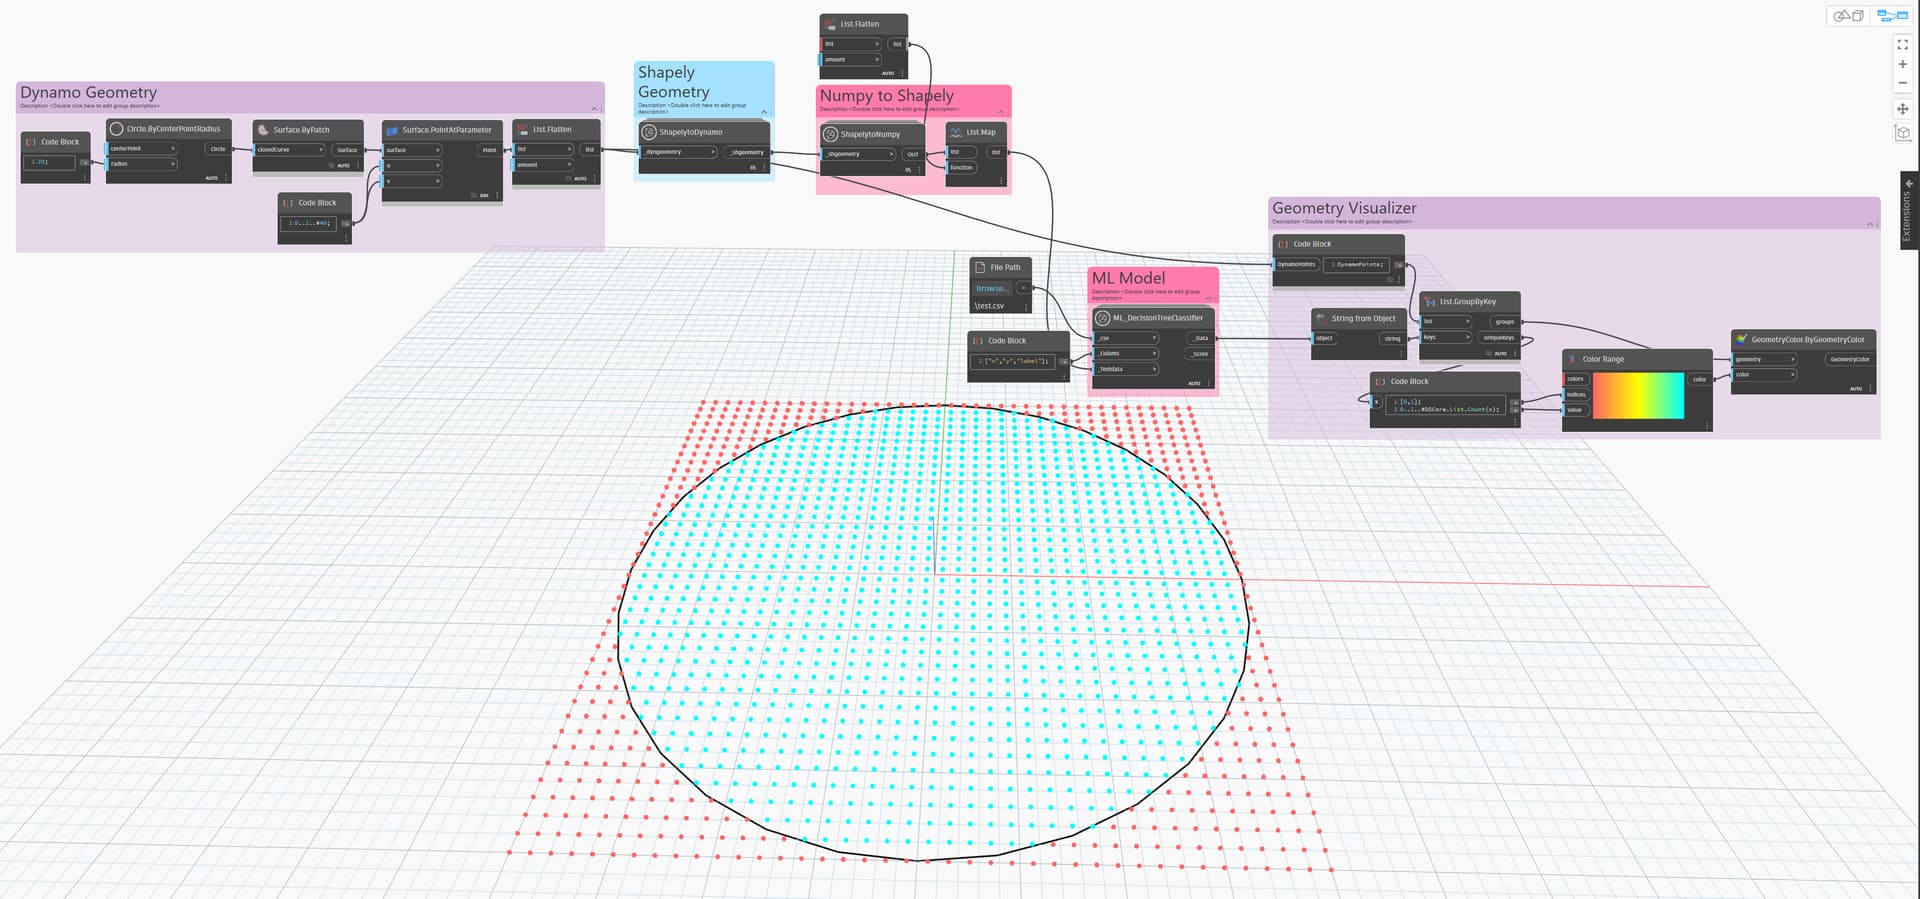
The aim of the above scenario is : To find out which of the points are inside the circle and which are outside the circle.
Traning Model
Convert points first to “ShapelyGeometry” and “Numpy”.
-
Then merge the variables into a single list.- here I used the “True and False” values obtained from the “ShapelyContains” node-
-
**Increase the list number by 1 with “”.
**Then use “ExportCSV” to convert the dataset to “.csv” format.-You can find this node in “Shapely>ML>Traning”.

- Edit Traning data : In the example, “x”, “y”, "z " values coming from the points will be "XTraning " data for us. The values coming from the variable are "YTraning " data and we should call them "label ". In this way, the Machine Learning Model will be able to observe which data is the base data to be used for training and how this base data changes. Briefly: We need to create a column named [“x”, “y”, “z”, “label”].
Here’s an example of the dataset:

Machine Learning Model
A very important part of the job is done. What we need to do now - just to have fun ![]() - is to choose the right Machine Learning Model according to our scenario. For this, it is necessary to examine a little Machine Learning Models. In a very simple summary, the table below will give you an idea.
- is to choose the right Machine Learning Model according to our scenario. For this, it is necessary to examine a little Machine Learning Models. In a very simple summary, the table below will give you an idea.

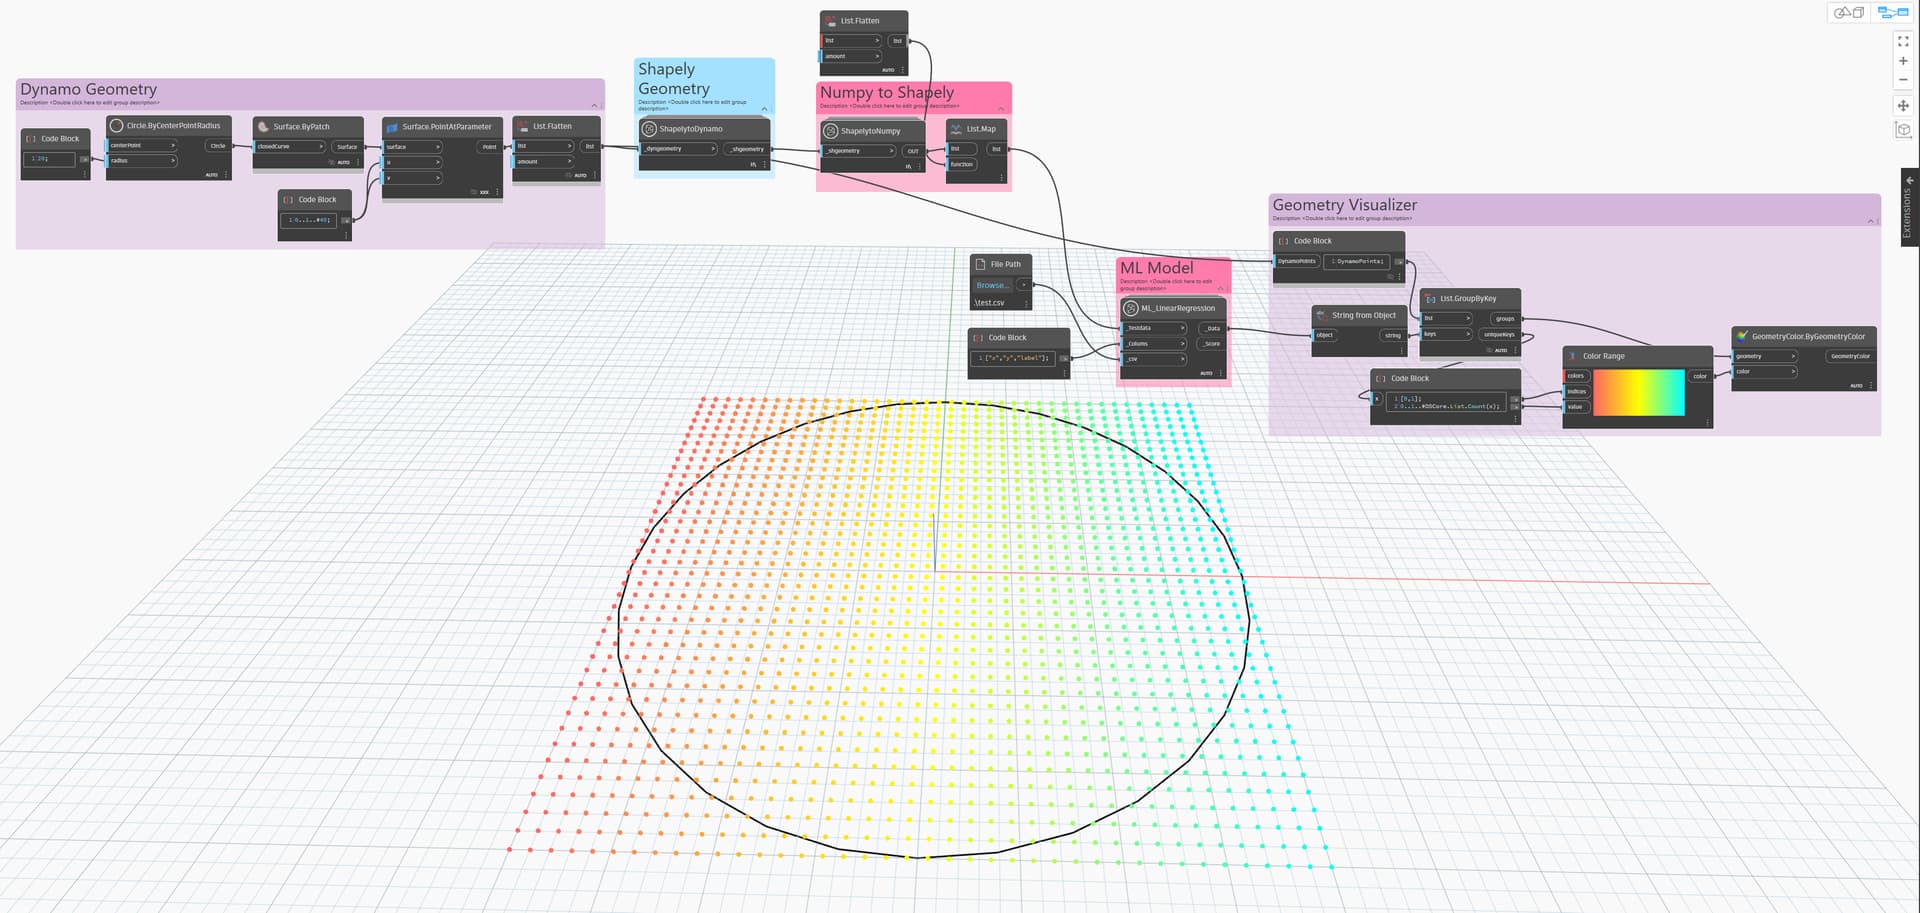
We will find the following training models in this package today, I want to show how we can get different results on the same dataset using each training model. Remember, when we created our dataset, we determined "Which point is in the circle and which is not ". In other words, some of the models will care about the variables of these points, while others will only look at the situation between the points. This is exactly why we can say that there are different results obtained from training models. Therefore, we should be very careful when choosing the training model to be used and choose the most appropriate model.
-
Decision Trees
-
K-Means

-
K-Nearest Neighbors ( K-NN)
-
Linear Regression
-
Random Forest
-
Spectrale Clustering

-
** Gaussian Mixture**


The Dynamo Forum does not accept “.csv” files, you need to change the file extension to “.csv”. (Test.xslx > Test.csv)
[test.xlsx|attachment](upload://bv
ML model.dyn (72.0 KB)
test.xlsx (45.8 KB)
Have fun with the power of Machine Learning!
