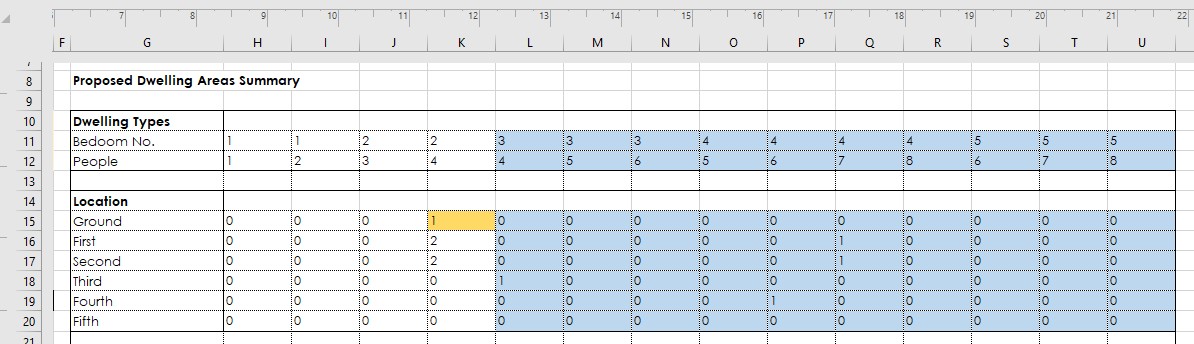
Hi, I am relatively new to Dynamo and I’m trying to compile a schedule that counts the number of flat types (1b2p, 2b3p, etc) per level and exports it to excel in the format as shown in the attached excel schedule.
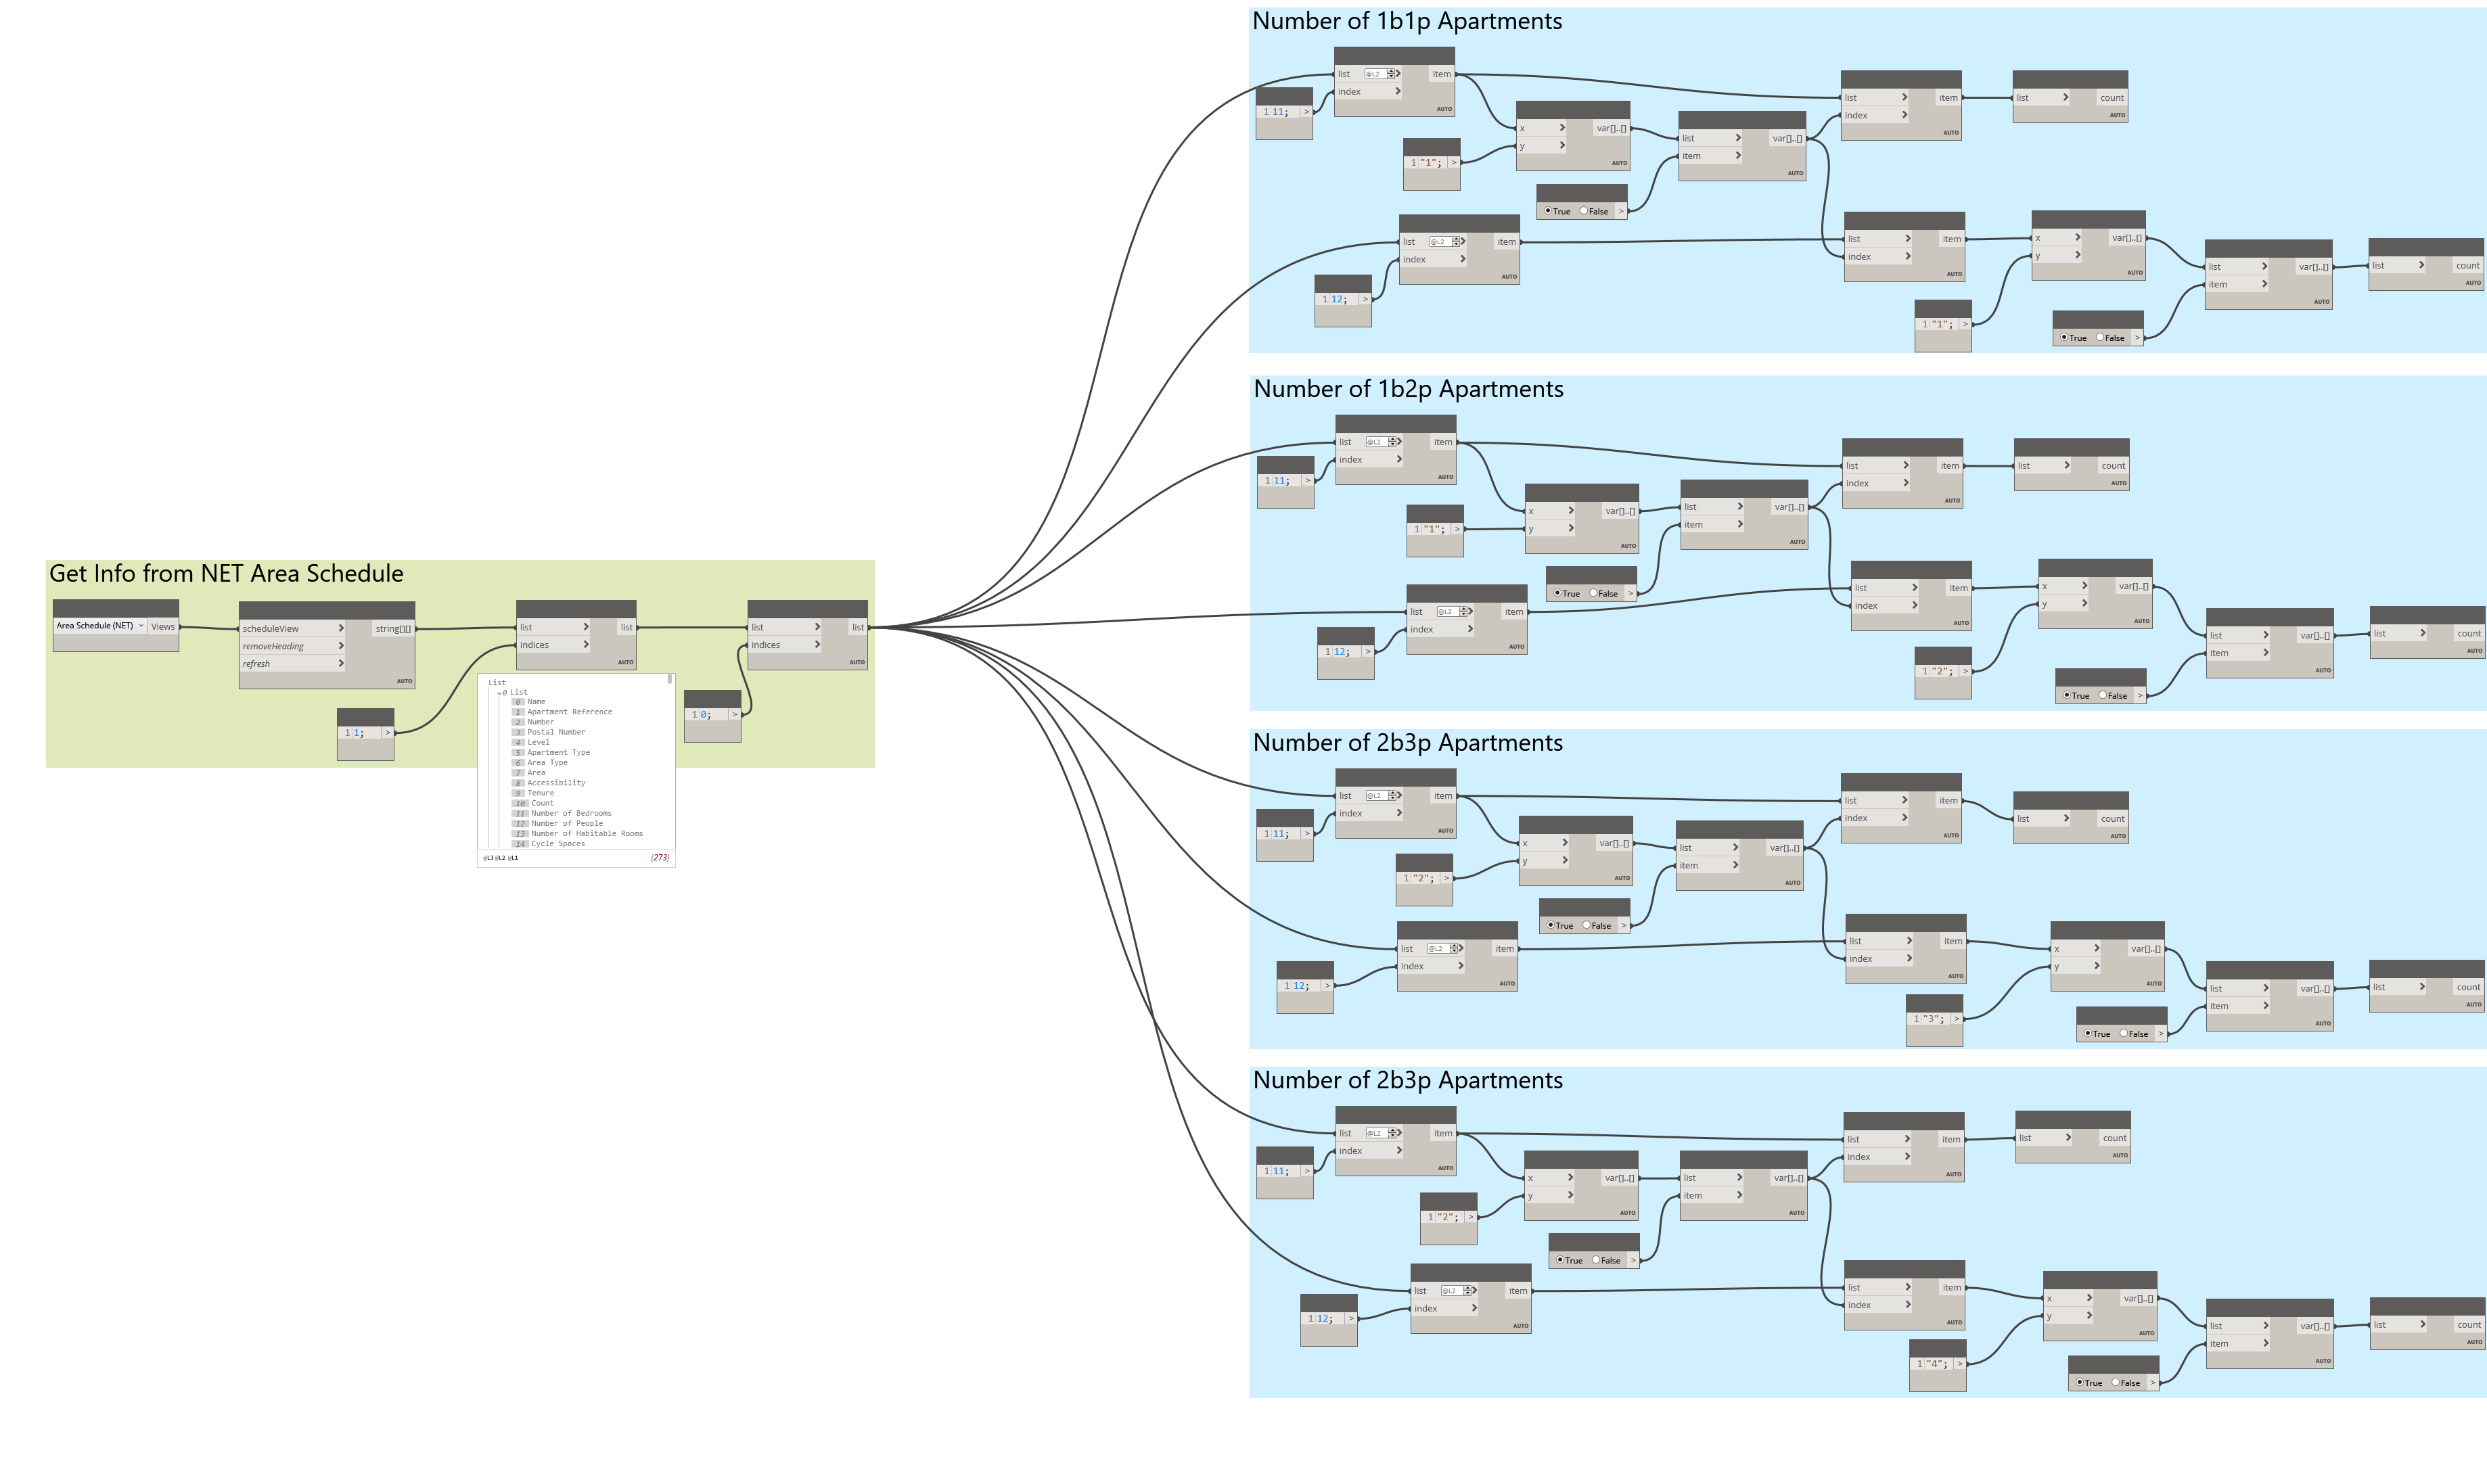
I have started to create a script which filters the flats into their types based upon the number of people and bedrooms entered into their respective parameters in the Revit area scheme, but I realise it’s going to get very messy if I proceed down this path, as I haven’t written a group for each area type, and levels aren’t even taken into account yet. I’m sure there’s a more sophisticated way of harvesting data and creating a matrix style schedule such as this so any pointers would be greatly appreciated! Thank you in advance!
Kind Regards
Howard