I’m working on a graph to identify which Zone my details lie in on my Sheets.
I have identified where the Views are on my Sheet, but I’m struggling with how to ID the Zone.
I’ve got a LIst of the X and Y values that determine the areas, but I’m looking for a node that will tell me which range the View lands in.
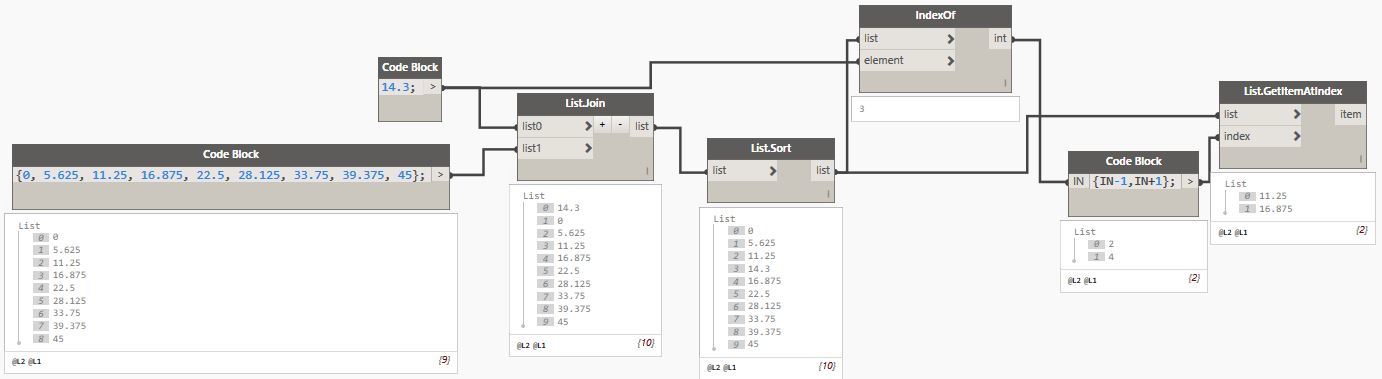
As a simplified example, my View has an X coordinate of 14.3
I have a list identifying my Zone’s X values as
0, 5.625, 11.25, 16.875, 22.5, 28.125, 33.75, 39.375, 45
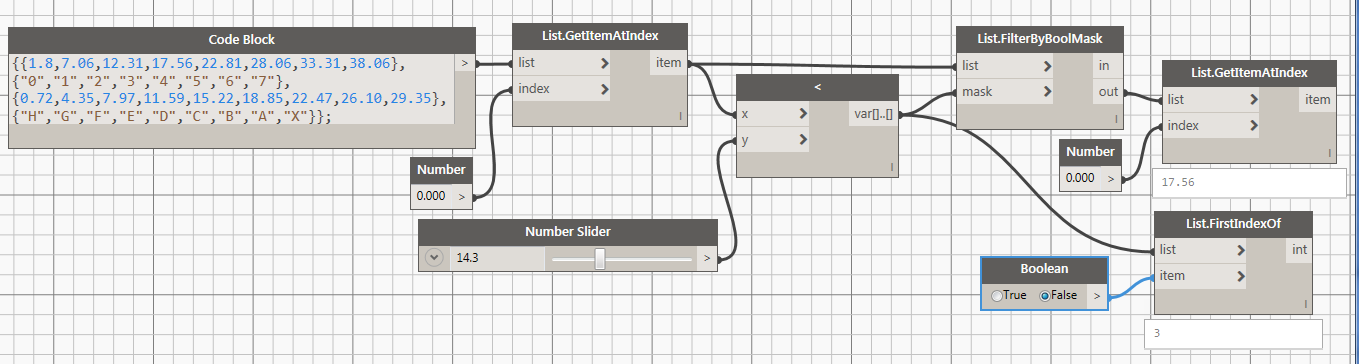
Is there a simple node that will return the indices of the list a give value falls between?
Or do I have to set up some sort of a loop to test each one?
In VB, I’d do a
Select Case
Case 0…5.625
"return value 1"
Case 5.6325…11.25
"return value 2"
End Select
Or something similar
Is there anything like that in Dynamo?
I tried the Clockwork “Switch” node, but it looks like that want exact values.